
Figure 2.
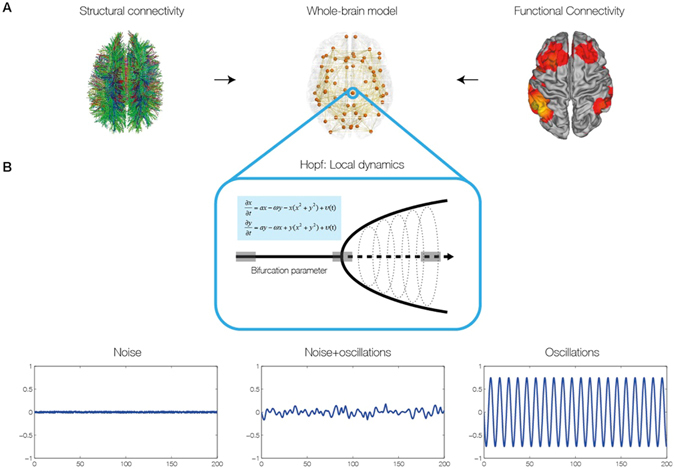
Construction of individual brain network models. (A) The brain network model was based on individual structural connectivity (SC) matrices from 24 participants derived from tractography of DTI (left) between the 68 regions of the Desikan-Kahilly parcellation (middle). The control parameters of the models were tuned using the grand average FC and FCD derived from fMRI BOLD data (right). (B) For modelling local neural masses we used the normal form of a Hopf bifurcation, where depending on the bifurcation parameter, the local model generates a noisy signal (left), a mixed noisy and oscillatory signal (middle) or an oscillatory signal (right). It is at the border between noisy and oscillatory behaviour (middle), where the simulated signal looks like the empirical data, i.e. like noise with an oscillatory component around 0.05 Hz.