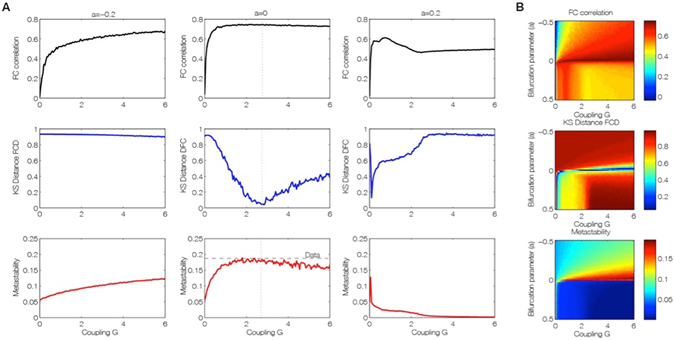
Figure 3.

Fitting of the empirical data by the brain network Hopf model for different working points. (A) Level of fitting of the FC, FCD and metastability as a function of the global scaling parameter G for three different bifurcation parameters a = [−0.2 0 0.2], namely at the noisy oscillatory region, at the edge of the bifurcation and at the oscillatory regime. (B) The three measures for assessing fitting between simulated and empirical data are shown color-coded as a function of bifurcation parameter a and global scaling parameter, G. The best fitting of the three measures is obtained for a region at the brink of the Hopf bifurcation, i.e. for bifurcation parameter a, at the edge of zero on the negative side. In this region not only the correlation between the empirical and simulated FC is maximized (upper panel), but also the statistics of the rapid switching between FC(t) across time (FCD) is minimized in Kolmogorov-Smirnov sense (middle panel), and the level of metastability of the data is perfectly reproduced (bottom panel).
