
Figure 4.
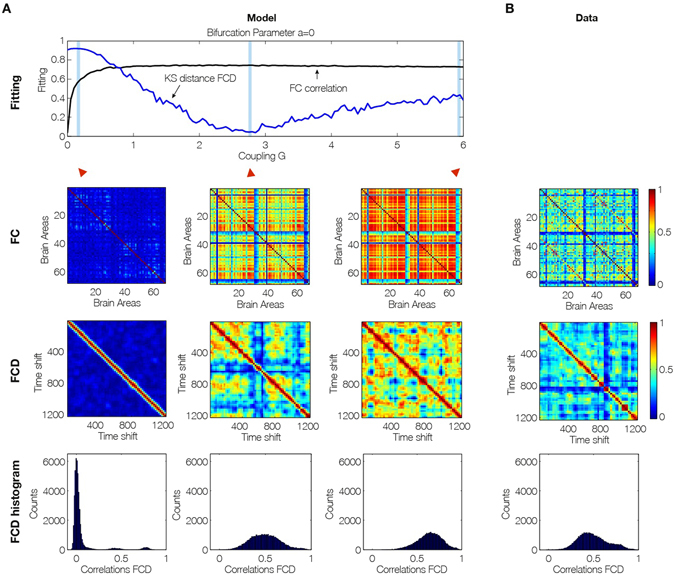
Fitting to the grand average FC is a necessary but not sufficient condition for best empirical fitting. (A) The figure shows the result of fitting the model to the empirical as a function of the global coupling parameter, G, at the optimal working point at the edge of the Hopf bifurcation (i.e. bifurcation parameter a = 0). Three different coupling points were selected (low, optimal and large in the three columns) and we show the resulting FC correlation, FCD correlations and FCD histogram. Note that for low G the FCD statistics does not show any switching between RSN and that for very large G there are too much switching between states. (B) For comparison, the same matrices and distributions are plotted for the empirical data. Note how only the FCD (row 2) and its statistics (row 3) are constraining enough for optimizing the working point the model to fit the empirical data (compare the distributions in row 3 and compare plots for FCD and FC fitting in row 1).