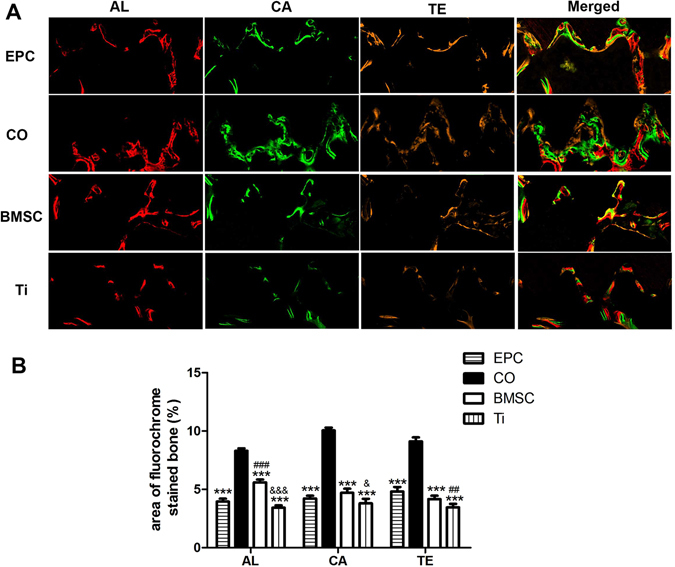
Figure 6.

Sequential fluorescent labeling of bone formation and mineralization. (A) Red, green and yellow represent labels of Alizarin Red S (AL), Calcein (CA) and Tetracycline Hydrochloride (TE) respectively for each group and merged images of the three fluorochromes for the same group (Original magnification x100). (B) The graph shows the percentage of the three fluorochromes area in each group. (***p < 0.001vs CO, ##p < 0.01, ###p < 0.001vs EPC, &p < 0.05, &&&p < 0.001 vs BMSC).
