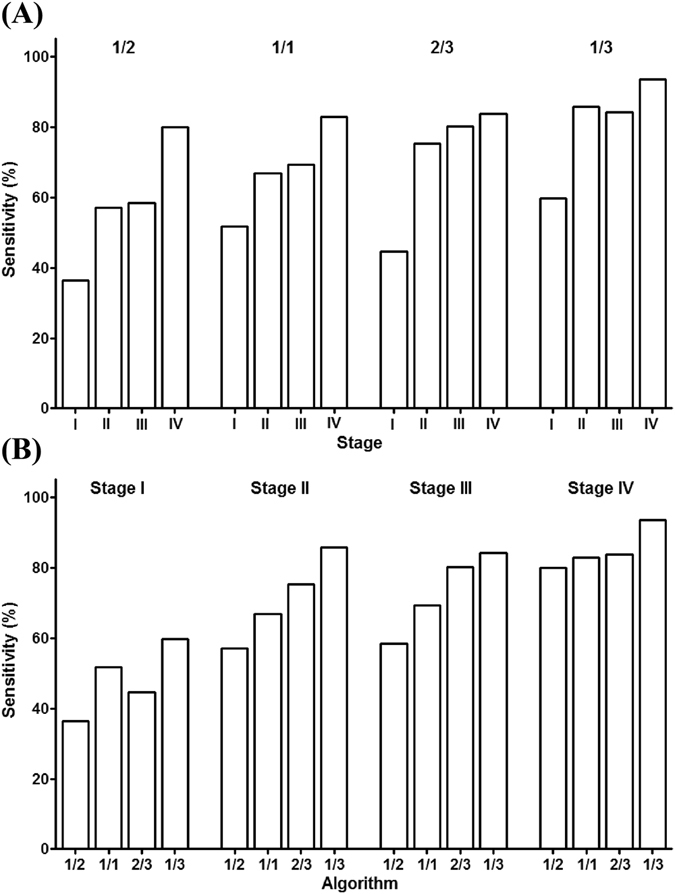
Figure 3.

The stage-dependent sensitivity for each CRC stage with 1/3, 2/3, 1/2 or 1/1 algorithm. Panel A compares the sensitivity for each CRC stage at each algorithm. It is clear that the sensitivity increased with the elevation of stages, no matter what algorithm was applied. Panel B compares the sensitivity calculated from each algorithm at each CRC stage. Generally, 1/3 algorithm exhibited the highest sensitivity, followed by 2/3, 1/1 and 1/2 algorithms, no matter what stage was compared.
