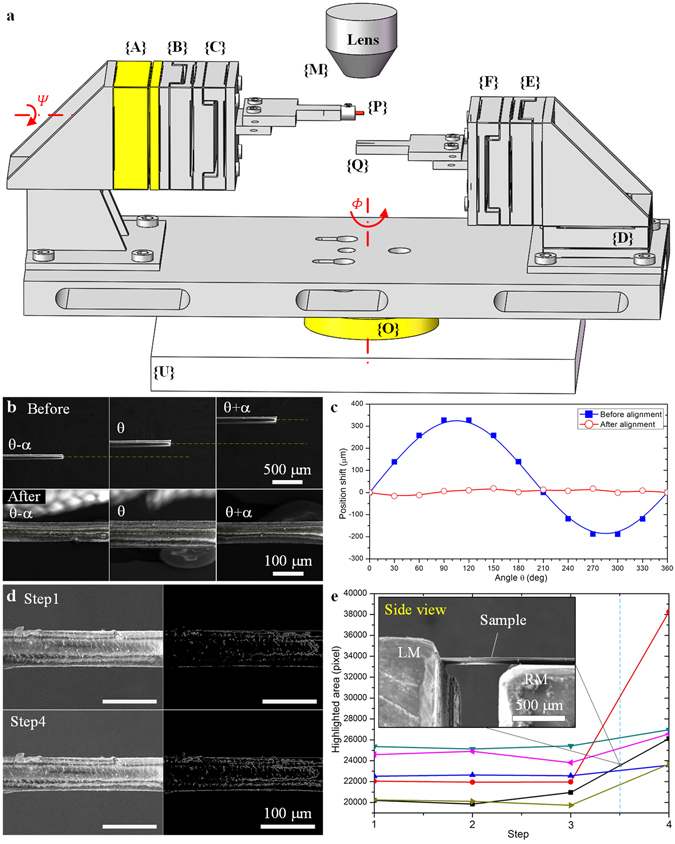
Figure 2.

Sample alignment on LM and RM. (a) Illustration of the initial assembly errors. Φ and Ψ are the initial rotational errors on the two rotational joints of the robot. (b) Sample’s position before and after LM alignment by TIA approach. α is chosen as 90°. (c) Offset ΔP err in one revolution (360°) before and after LM alignment. (d) SEM image and highlight area (unit: pixel) of the sample at initial condition and after deformation, corresponding to the black line in (e). (e) Changing of the highlighted area during the upward movement of RM. Six experiments are designed independently by taking six different samples. The side view image is taken at step 3.5 corresponding to the sample indicating by black line.
