Figure 1.

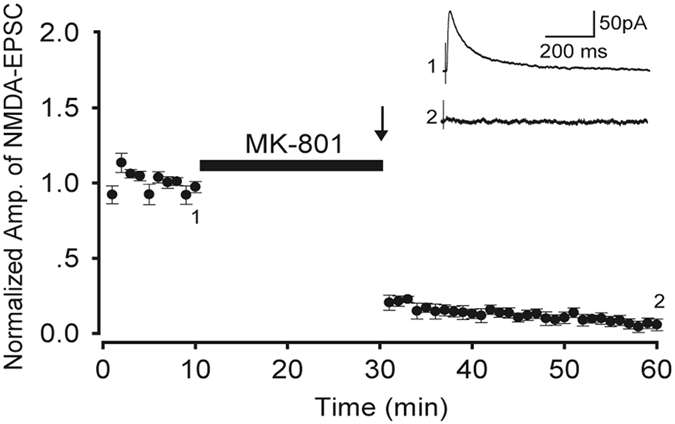
Amplitude of NMDA-EPSCs before and after blocking S-NMDARs. The arrow represents the stimulation time point. Inset: sample traces of NMDA-EPSC at time points 1 and 2, as marked. Data are from nine slices of five mice.

Amplitude of NMDA-EPSCs before and after blocking S-NMDARs. The arrow represents the stimulation time point. Inset: sample traces of NMDA-EPSC at time points 1 and 2, as marked. Data are from nine slices of five mice.