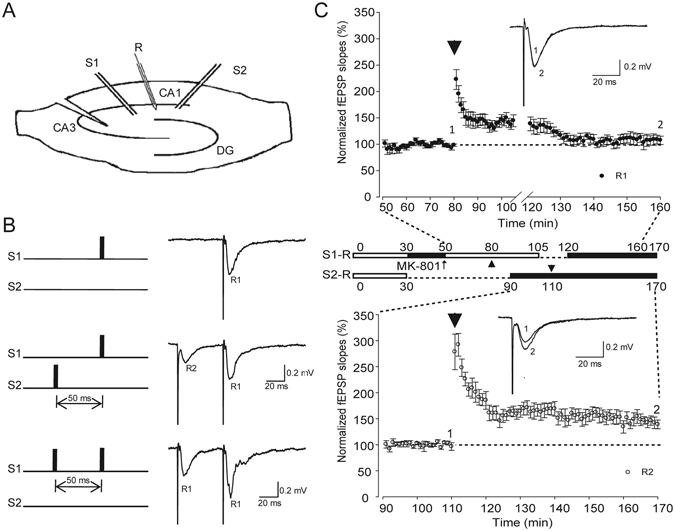
Figure 3.

Comparison of LTP induction in two independent pathways. (A) Schematic diagram showing the two-pathway experiment. (B) Paired pulse facilitation tests of the two pathways. Upper: Stimulation of S1-evoked field EPSP (R1); Middle: Stimulation of S2 (50 ms prior to the stimulation of S1), which did not change in the amplitude of R1; Lower: Paired pulse in the same inter-stimulus interval in S1 facilitated R1. (C) LTP inductions in two pathways of the same slices. Single test stimuli were delivered to S1 and S2 alternatively every 30 s. Upper: Summary of normalized fEPSP slopes in S1-R pathway (n = 7). Middle: MK-801application (30–50 min) followed by 5 Hz stimulation in S1 (16 s). From 105 to 120 min, single test stimuli were stopped upon the delivery of HFS to S2, to avoid heterosynaptic plasticity. Lower: Summary of normalized fEPSP slopes in the S2-R pathway (n = 7). LFS and 3-train HFS are represented with thin and thick arrow heads, respectively.
