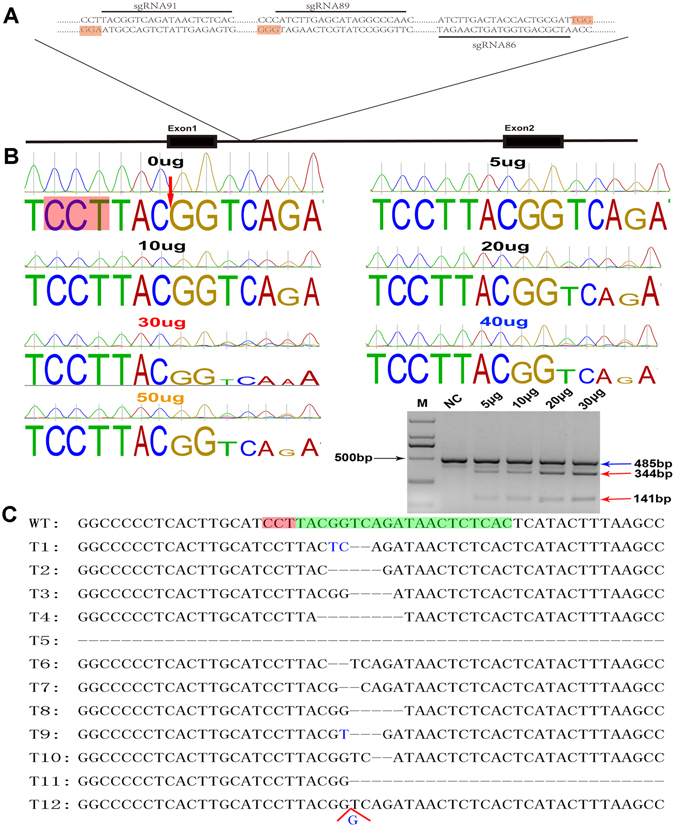
Figure 2.

Optimization of the mutation/cutting efficiency at the pROSA26 locus in PFFs. (A) Scheme for site-specific targeting/cutting of the pROSA26 locus on chromosome 13 by CRISPR/Cas9. (B) Chromatograms of the PCR amplicons for each CRISPR/Cas9 dose group (0 μg, 5 μg, 10 μg, 20 μg, 30 μg, 40 μg and 50 μg). The red arrow indicates the cleavage site, and the PAM is underlined in red. The mutation efficiency for each CRISPR/Cas9 dose (5 µg, 10 µg, 20 μg and 30 µg) was determined by using the T7E1 cleavage assay. M: 100 bp DNA ladder. NC: Negative control, transfection dose of CRISPR/Cas9 was 0 µg. The blue arrows indicated wild type bands and the red arrows indicated cleaved amplicons. (C) The TA cloning and sanger sequences were analysed for indels. The wild-type sequence is located on the first line (WT), and the mutated sequences from the TA cloning are arranged below (T1~T12). The target site is indicated in green; the PAM is indicated in red.
