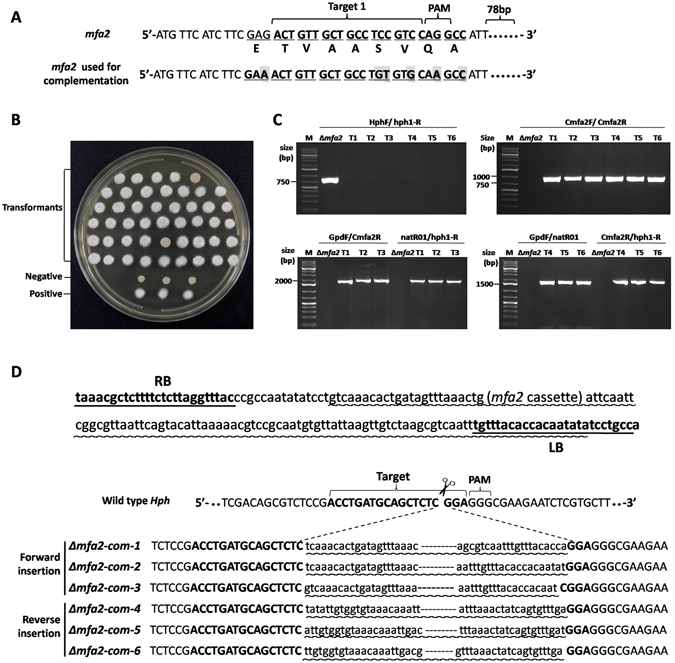
Figure 3.

Identification and characterization of Mfa2 complementation transformants. (A) Nucleotide and amino acid sequences of wild-type and base-modified Mfa2 target locus. (B) Mating assays of Mfa2 complemented transformants. The fluffy colonies are the result of successful mating, while the dense colonies indicate a fail in mating. The negative control is haploid JG35 with yeast-like colony, and the positive control is a mix of JG35/JG36 with filamentous hyphae. (C) PCR characterization of the complemented transformants. The up/left: detection of the Hph gene; the up/right: detection of the introduced Mfa2; the down/left: forward insertion, the sizes of PCR products were 1686 bp with primer pair GpdF/Cmfa2R and 1676 bp with primer pair natR01/hph1-R; the down/right: reverse insertion, the sizes of PCR products were 1624 bp with primer pair GpdF/natR01 and 1738 bp with primer pair Cmfa2R/hph1-R. (D) Sequences of the Hph flanking the insert at target locus of the complemented transformants. Underlined are RB and LB regions. The insertion regions are marked with wavy line. As could been seen, in both forward or reverse insertions, the whole RB and a small portion of the cassette at the 5′ end were lost, but only 8–15 LB nucleotides at the far most 3′ end were lost.
