Figure 4.

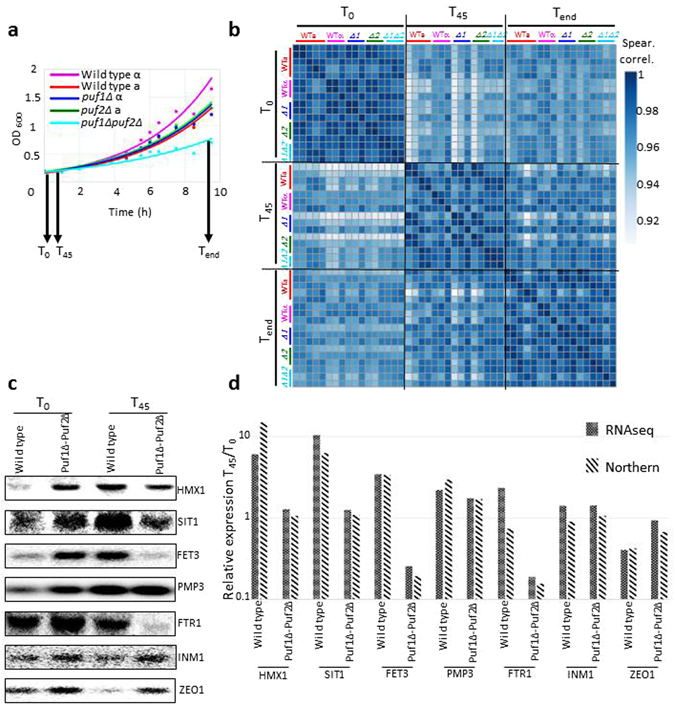
RNA-seq reproducibility and validation. (a) Growth curves of the five strains (yA635, yA995, yA1382, yA637, yA639) that were subjected to RNA-seq analysis. RNA was isolated before the addition of 0.3 M CaCl2 (T0), after 45 minutes of CaCl2 addition (T45), and after ~9 hours (Tend). Samples were subjected to RNA-seq or northern analyses. (b) Spearman’s correlation heatmap of unclustered RNA-seq biological replicates for all strains at three timepoints. Note that the scale of the Spearman values starts at 0.9. Actual values are provided in Supplementary Table 2. (c) Northern analyses of total RNA extracted from wild-type (yA635) and puf1Δpuf2Δ (yA639) strains for untreated (T0) and 0.3 M CaCl2 treated (T45) samples. Radiolabeled PCR products of the genes indicated to the right were used as probes. (d) Bands in the northern blot (c) were quantified with ImageQuant, and the ratio for the signals at T45 to T0 are presented for each gene (stripes). RNA-seq results (weave) for the same genes from the same biological replica are presented. Compatibility of the results was calculated using Pearson correlation (p value = 0.005).
