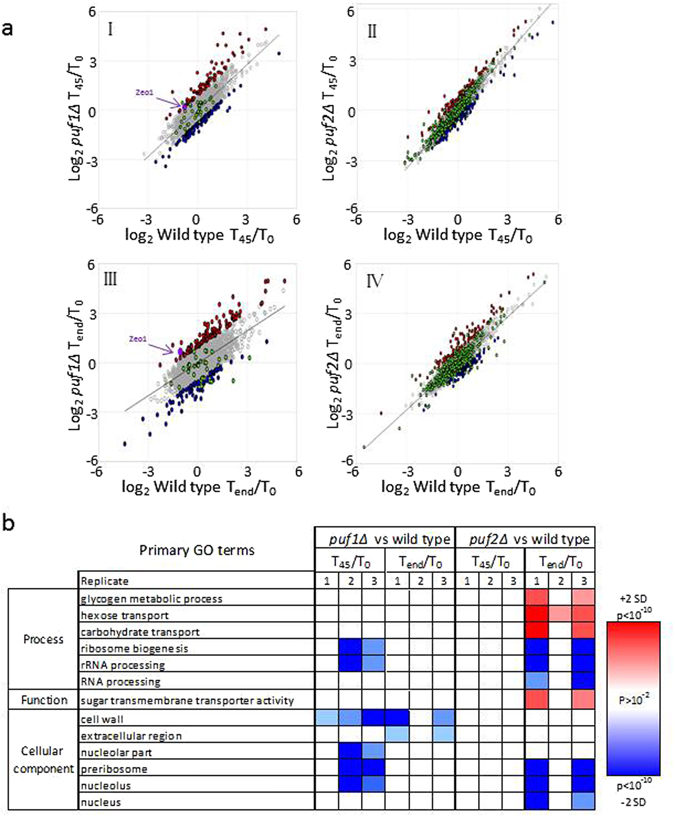
Figure 6.

Distinct effects of Puf1 and Puf2 on gene expression. (a) Scatterplots of log2 normalized reads of puf1Δ (yA1382) against its isogenic wild-type (yA995) in T45/T0 (I) and Tend/T0 (II), and puf2Δ (yA637) against its isogenic wild-type (yA635) in T45/T0 (III) and Tend/T0 (IV). Genes significantly affected from the knockouts are colored in red (significantly higher effect) or in blue (significantly lower effect). Genes that were previously shown to be bound by Puf113 or Puf213, 15 are indicated in green. This scatter is for one of the biological replicates, and the additional ones are shown in Supplementary Table S4. (b) Heatmap of SGD GO enrichment analysis of significantly affected genes in T45/T0 and Tend/T0 in puf1∆ and puf2∆ relative to their isogenic wild-type strains. The red or blue shades indicate levels of enrichment score if induced or repressed, respectively. The color intensity indicates the level of p value enrichment score of each GO term. Only primary GO terms with p value <10e−2 and FDR < 10−2 were included. Full results are presented in Supplementary Table S4.
