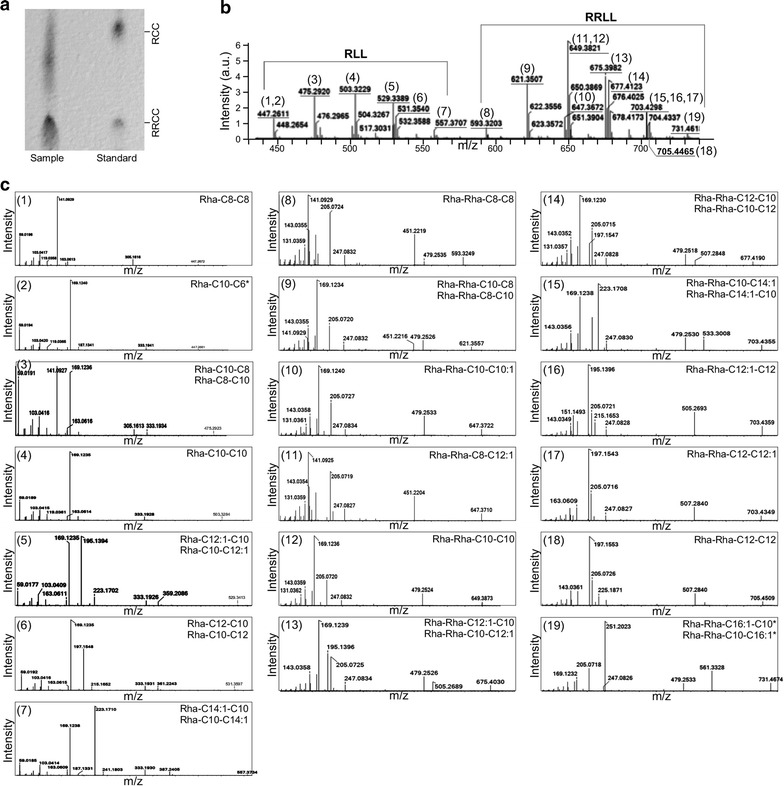
Fig. 3.

Identification of various types of rhamnolipids produced by P. aeruginosa ZS1. a Thin layer chromatographic analysis of the rhamnolipids produced by P. aeruginosa ZS1. Sample and standard molecules are indicated. Positions of the reference molecules Rha-C10-C10 and Rha-Rha-C10-C10 are indicated. b MS spectra of the rhamnolipids produced by P. aeruginosa ZS1. X- and Y-axis indicate m/z (mass-to-charge ratio) and intensity (arbitrary unit), respectively. Number in parentheses indicates various types of rhamnolipids detected in supernatant of P. aeruginosa ZS1. c MS–MS spectra of the individual peaks shown in MS spectra (b). Display is identical to b. Top right and left indicate the number of peaks shown in b and formulas of rhamnolipids. Asterisk indicates the rare type of rhamnolipids whose spectra was not reported previously
