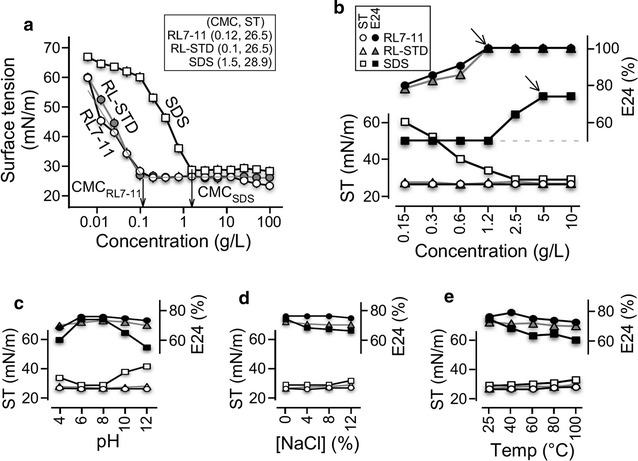
Fig. 5.

Comparative analysis of surfactant activity between RL7-11, RL-STD, and SDS. a Analysis of CMC-RL7-11, CMC-RL-STD, and CMC-SDS. X- and Y-axis indicate surfactant concentration in g/l and surface tension in mN/m, respectively. b Analysis of surface tension and emulsification capacity E24 index against crude oil. Solid and open marks indicate surface tension in mN/m and E24 index in percent. Circle, triangle, and square indicate RL7-11, RL-STD, and SDS, respectively. Analysis of surfactant activity under various pH, salinity, and temperature conditions is shown in c, d and e, respectively. The display is identical to b
