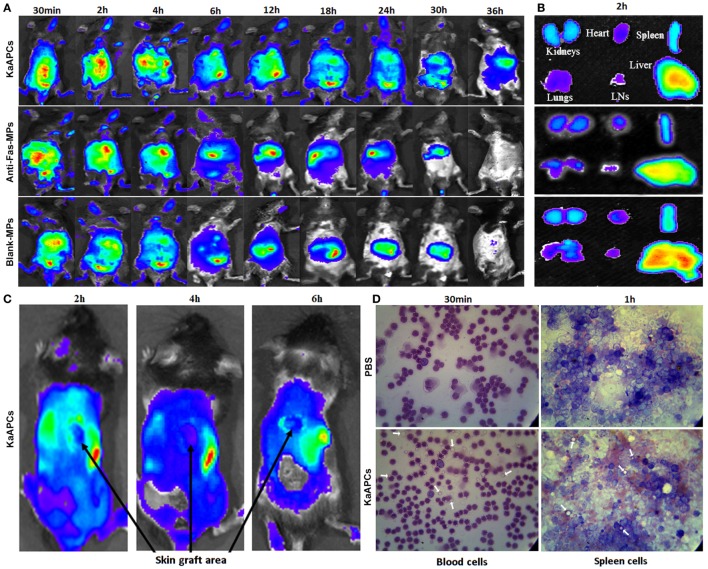
Figure 6.
In vivo tracking and tissue distribution of killer artificial antigen-presenting cells (KaAPCs). Grafted bm1 mice were injected via the tail vein with indocyanine green-encapsulated KaAPCs, anti-Fas-MPs, or Blank-MPs. Fluorescence images were then acquired using the Maestro in vivo imaging system at different time points. (A) Whole-body fluorescence images for in vivo tracking of KaAPCs and the control microparticles (MPs). (B) Distribution of KaAPCs and control MPs in the excised organs 2 h after injection as displayed by ex vivo imaging. (C) Few KaAPCs circulated into the location of alloskin graft at 2-, 4-, and 6-h time points, as analyzed by whole-body fluorescence imaging. (D) Wright’s staining for peripheral blood cells and spleen cells (SPCs). KaAPCs were observed in the blood cells suspension at 30-min time point and in the SPCs’ suspension at 1-h time point after i.v. injection in the KaAPCs group. Meanwhile, no KaAPC was found in the PBS injection group. White arrows point at the KaAPCs.

