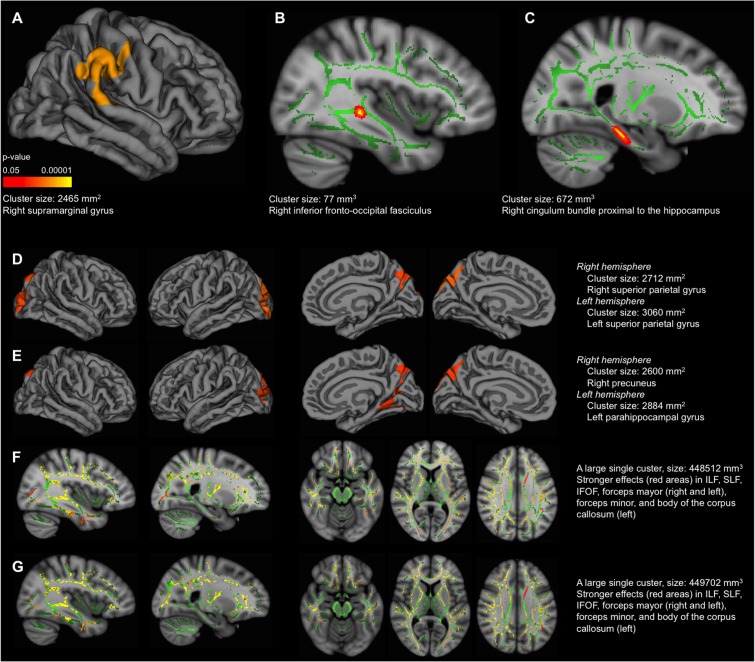
FIGURE 3.
Correlation between cognitive measures and cortical thickness/mean diffusivity (MD). These correlations were performed in the older group. MRI data and values for the global deviation index were available for 18 individuals. MRI data and values for visual abilities were available for 24 individuals. MRI data and values for language were available for 23 individuals. The results displayed in the figure correspond to the sample based on the global deviation index (n = 18) to allow comparability across the three cognitive measures. The same correlations were replicated for visual abilities and language in 24 and 23 individuals, respectively. The pattern of results was similar for MD, although significant correlations were mainly found in the right hemisphere; and results did not survive the Z Monte Carlo cluster-forming threshold for cortical thickness, although similar results were observed at the uncorrected level (data not shown). Cortical thickness (A,D,E): lateral view of the right hemisphere in (A). Lateral view of the right and left hemispheres (first and second images from left, respectively), and medial view of the right and left hemispheres (third and fourth images from left, respectively), in both (D,E). Correlation with the global deviation index in (A), correlation with visual abilities in (D,E), including WAIS-III Information as covariate in (E). Significant vertexes are displayed as colored scale (cluster-forming threshold yielding clusters corrected for multiple comparisons) with red–yellow indicating a positive correlation in (A,D,E). MD (B,C,F,G): (B) intermediate view (x coordinate = 51 mm) of the right hemisphere. Significant voxels are displayed in red–yellow (FWE corrected), showing a negative correlation. Significant voxels were thickened for easier visualization; (C) intermediate view (x coordinate = 66 mm) of the right hemisphere. Significant voxels are displayed in red (uncorrected p < 0.001), showing a negative correlation. Significant voxels were thickened for easier visualization; (F,G) intermediate view (first and second images from left, x coordinates = 51 and 66 mm, respectively) of the right hemisphere in sagittal plane; intermediate view (third, fourth, and fifth images from left, z coordinates = 56, 79 and 102 mm, respectively) in axial plane. In all (F,G) images, significant voxels are displayed in red–yellow (FWE corrected), showing a negative correlation. Correlation with the global deviation index in (B,C), correlation with visual abilities in (F,G), including WAIS-III Information as covariate in (G). The green regions in (B), (C), (F) and (G) represent the mean white matter skeleton. ILF, inferior longitudinal fasciculus; SLF, superior longitudinal fasciculus; IFOF, inferior frontal–occipital fasciculus. All the regions labeled in the figure correspond to the cluster maximas (e.g., right supramarginal gyrus).

