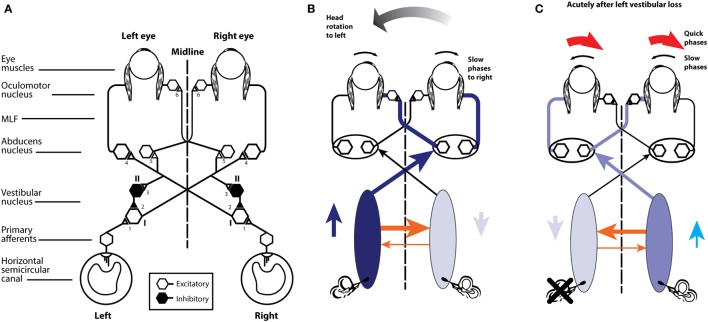
Figure 5.
(A) Schematic view of the brainstem showing the basic projections underlying the horizontal VOR. The synapses are numbered and the papers giving evidence for each synapse are given in Table 1. Reprinted from Ref. (28), © 1995, with permission from IOS Press. (B) A depiction of the neural activity in the VOR network during a head turn to the left, eliciting a compensatory eye movement response to the right (see text for a full description). Increased activation is shown by the darker blue and the thicker orange shows the increased commissural inhibition from the activated vestibular nucleus. (C) With head stationary, a unilateral vestibular loss (left here) elicits an imbalance in neural activity between the two vestibular nuclei. The absence of primary vestibular input means that the left vestibular nucleus has reduced activity (light blue), which in turn generates a reduction in commissural inhibition to the right vestibular nucleus (thin orange line), allowing the cells in the right nucleus to fire at a higher firing rate, resulting in the slow phase of vestibular nystagmus to the left and quick phase to the right (red arrows).

