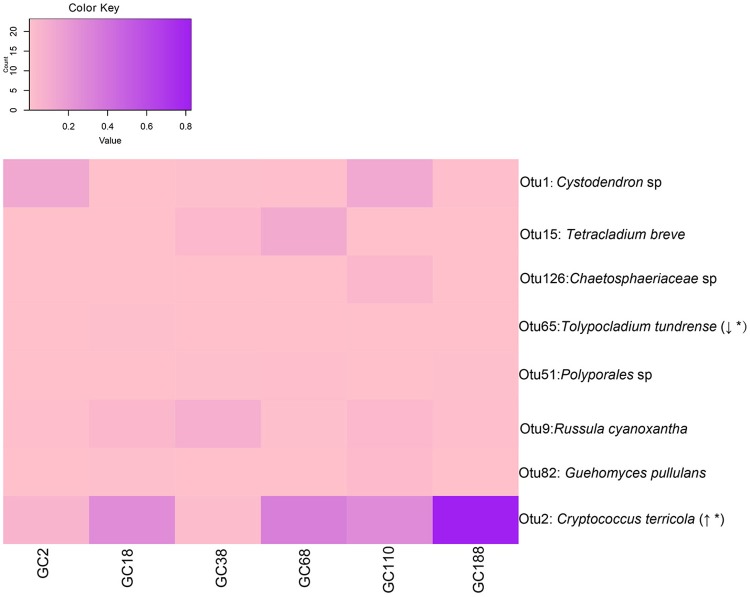
Figure 5.
Fungal OTUs occurred in all sites and they changed in frequency with successional age (i.e., distance from the glacier terminus). Italic type refers to the best BLASTn match (nr/nt) with the exclusion of uncultured/environmental samples. Linear regression of abundance of those OTUs along the chronosequence. Direction of change indicates if the abundance of OTUs increased (↑) or decreased (↓) across the distance from the glacier. Asterisk (*) indicates statistical significance. The relative abundance of OTUs are depicted by color intensity, with the legend indicated at the top of the figure. The increasing color intensity indicated a higher relative abundance.

