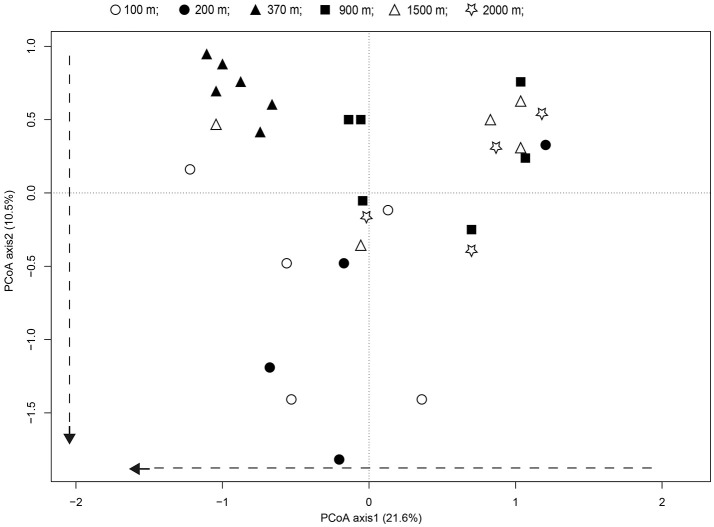
Figure 6.
Patterns of fungal communities across successional distance in the glacier chronosequence. Principal coordinates analysis PCoA representing the overall variability in fungal communities. Variance explained by each PCoA axis is given in parentheses. The PCoA of the fungal community showed strong successional trajectories, with dashed arrows representing the direction of community shifts as indicated by significant linear regression statistics.

