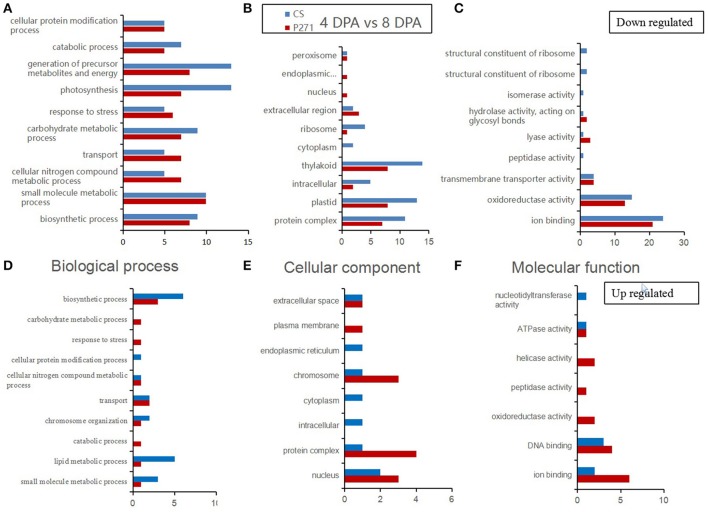
Figure 3.
Bar diagrams showing distribution of differentially expressed proteins in wheat cultivars CS and P271 in the 4 vs. 8 DPA (days post anthesis) comparison. The proteins were classified based on their predicted functions into: Biological process, (A) down regulated and (D) up regulated; Cellular component, (B) down regulated and (E) up regulated; and Molecular function, (C) down regulated and (F) up regulated.

