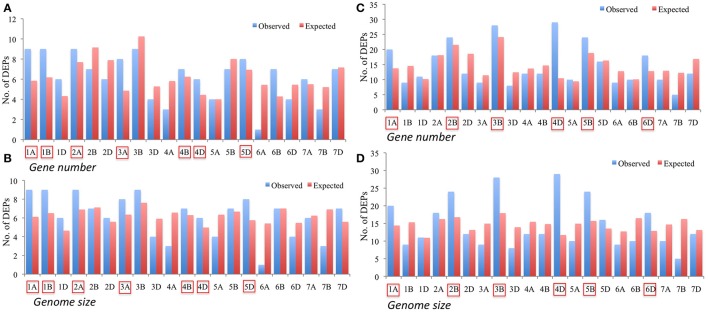
Figure 8.
Bar diagrams showing distribution of differentially expressed proteins (DEPs) on specific chromosomes with expected number of DEPs calculated based on genome size (A,C) and gene number (B,D). Panels (A,B) represent distribution of 130 DEPs identified from a comparison between CS and P271, whereas Panels (C,D) show distribution of 306 DEPs identified from the comparisons made between different developmental stages (4 vs. 8 DPA and 12 vs. 8 DPA). Chromosomes exhibiting more observed than expected number of DEPs are marked.

