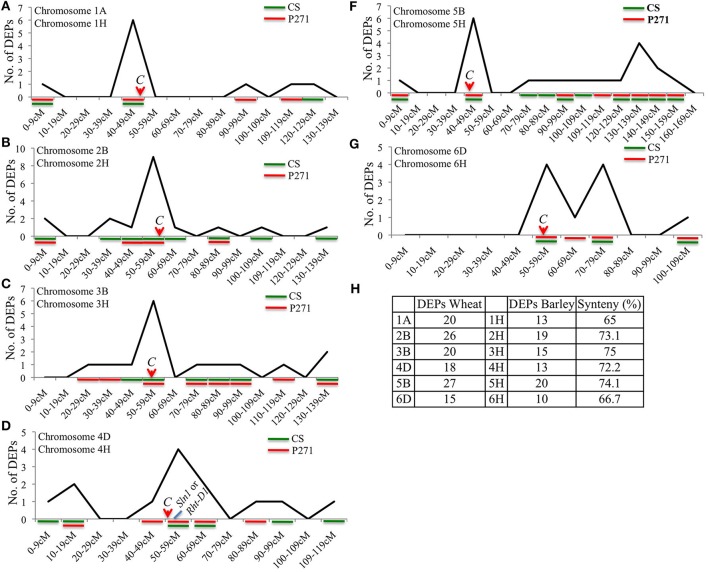
Figure 9.
Chromosomal distribution of 306 DEPs shown on syntenous barley chromosomes 1H (A), 2H (B) 3H (C), 4H (D), 5H (F), and 6H (G). Genotypes contributing for DEPs were also shown in each figure. Level of synteny between wheat and corresponding barley chromosomes is shown in (H). C = centromere.

