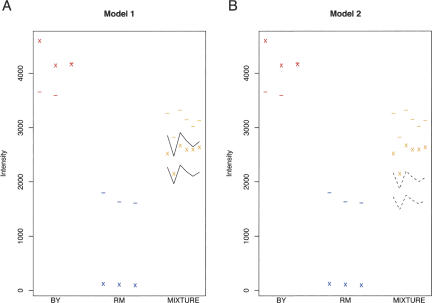
Figure 4.
Examples illustrating the use of the 1:1 mixture to estimate the false positive and sensitivity of the method for detecting allele-specific expression. In each plot, the x's represent the observed intensities (I) and the dashes represent the expected intensities (Î) for a marker probe located in FKS1. Note that the probe represents a good marker, because the I/Î ratio is much greater in BY than in RM. For this transcript, the expected probe intensities for the three BY replicates are approximately twofold higher than in the three RM replicates, suggesting that the transcript is expressed at a higher level in BY. A 1:1 mixture of total mRNA from BY and RM would therefore contain approximately two times as much of the BY FKS1 allele as the RM allele. (A) Model 1 analyzes the false-positive rate. Here, the solid lines in the 1:1 mixture represent the predicted range for the observed probe signals under a model that correctly accounts for the twofold overabundance of BY allele. The observed signals from the 1:1 mixture replicates fall within this range, providing no evidence for deviation from the model. (B) Model 2 analyzes the power. Here, the dashed lines represent the predicted range of the observed probe signals under a model assuming equal expression of both alleles. All six observed intensity signals in the 1:1 mixture fall above this range, correctly revealing that the 1:1 mixture contains more BY allele than RM allele for this transcript.

