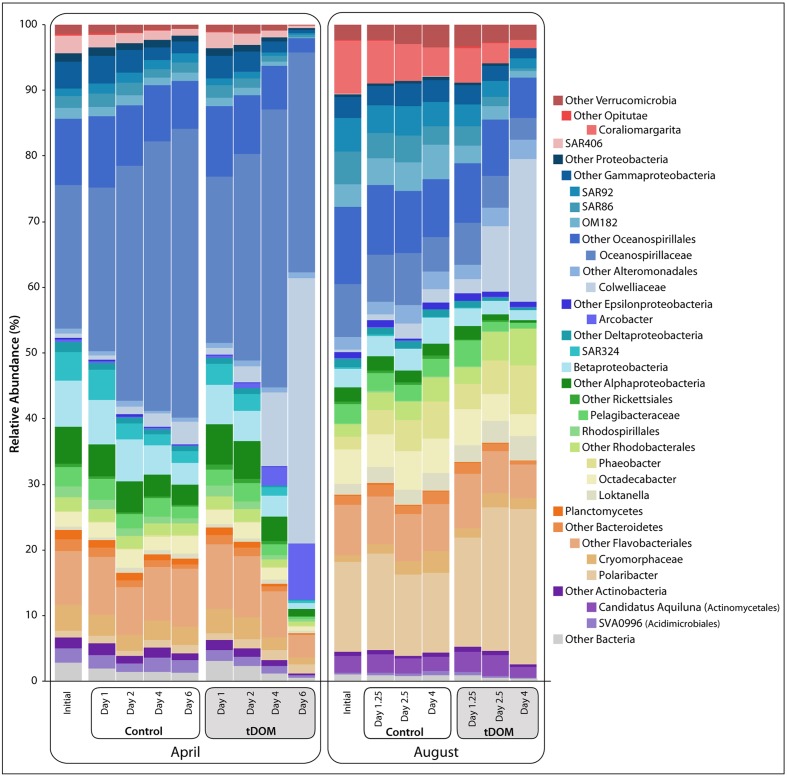
FIGURE 2.
Bacterial relative abundance with tDOM additions. Stacked bar chart of bacterial taxonomy throughout the course of the bioassays [Controls and treatments with additions of terrestrial-derived dissolved organic matter (tDOM)]. Taxonomy was assigned in QIIME (v. 1.8) using the RDP classifier (Caporaso et al., 2010) based on DNA sequences, randomly subsampled to 3037 sequences per sample, from the v4 region of the 16S rRNA gene. Major bacterial phyla are further broken down into more specific taxonomic ranks (class or order) to highlight the dynamics of these taxa throughout the bioassays.

