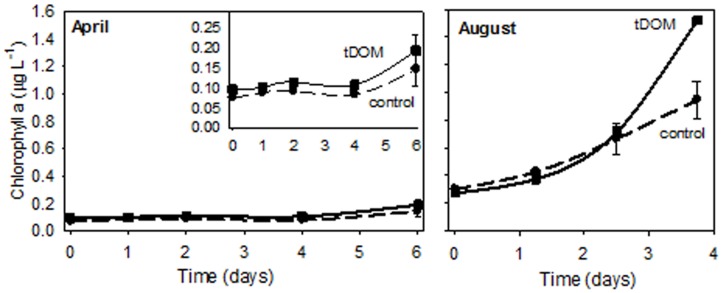
FIGURE 4.
Chlorophyll a response to tDOM additions. Change in Chl a concentrations for the ice-covered (April) and open-water (August) bioassays. The inset in the April figure zooms in on the lower range of the Chl a scale. Control treatments are indicated by a dashed line and treatments with additions of tDOM are indicated using a solid line.

