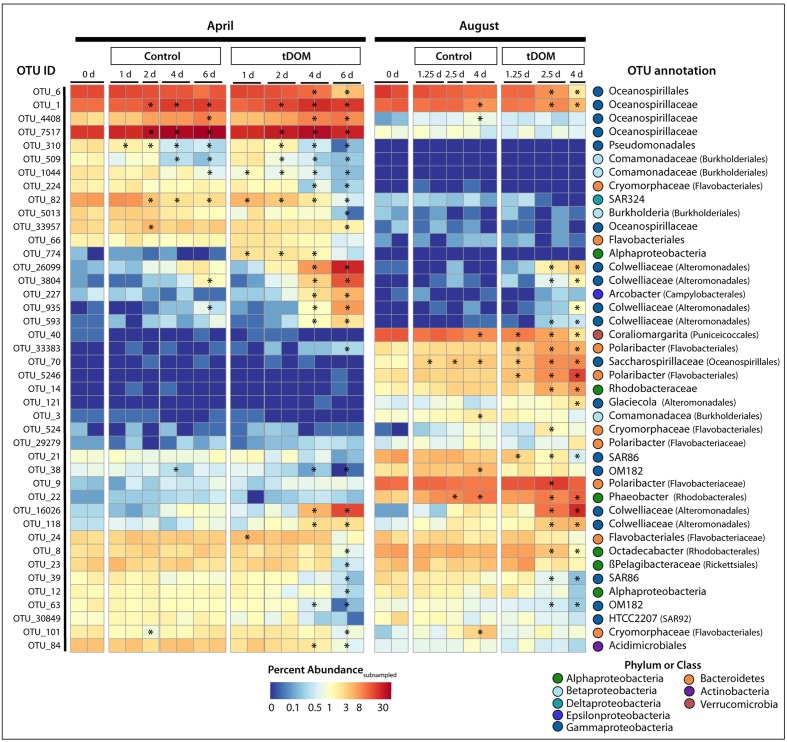
FIGURE 6.
Change in operational taxonomic unit (OTU) relative abundance. Heatmap showing the percent abundance of OTUs identified to significantly change (adjust p-value < 0.05) in relative abundance over the course of the bioassays. Plotted are OTUs that were at least 1% of the total number of subsampled sequences in at least one sample. The OTU ID is noted to the left of the heatmap while the annotation, given as the lowest taxonomic level, is to the right of the heatmap. The bioassay (April or August), treatment (Control or tDOM) and timepoint (in days) are noted above the heatmap. Finally, for each OTU, asterisks within the heatmap denote a sample or pair of samples (duplicates) that have a relative abundance that is significantly greater or less than the Control.

