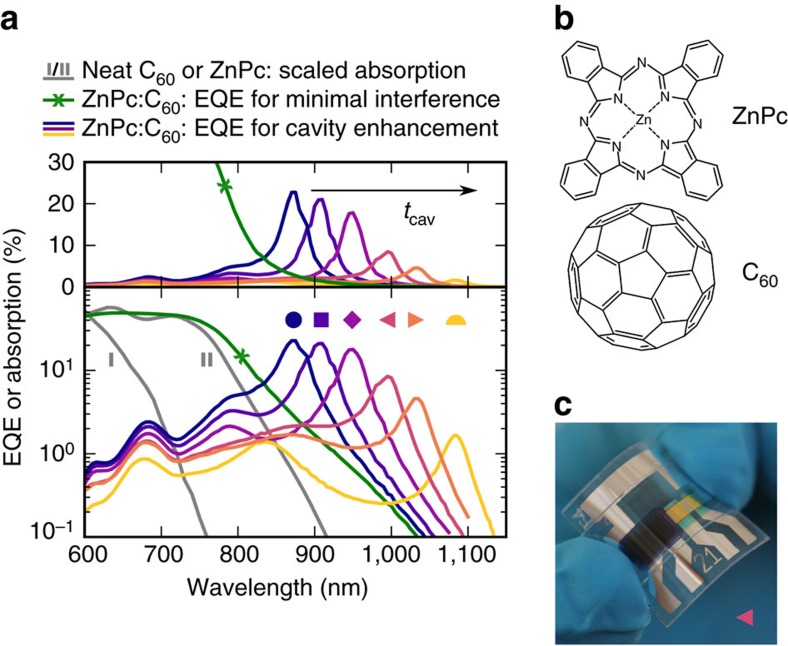
Figure 2. NIR detectors based on ZnPc:C60 CT absorption.
(a) Spectrally resolved EQE or absorption on linear (top) or logarithmic (bottom) scale. The green, crossed line indicates the EQE of a ZnPc:C60 solar cell with minimal optical cavity effect. The grey lines are scaled to the previous curve and represent the absorption of neat C60 (marked as I) or ZnPc (marked as II). The remaining curves show the EQE of several cavity-enhanced ZnPc:C60 detectors, measured at short circuit. Tuning the cavity thickness tcav via a simultaneous thickness variation of both transport layers allows shifting the resonance wavelength. Both samples marked as triangles are mechanically flexible, while the remaining are encapsulated with glass. (b) Chemical structures of the blend constituents. (c) Photograph of a flexible device, marked as ◂ in a. The left half of the photo-active area features a sequence of neat absorbers to suppress the photo-response from visible light.

