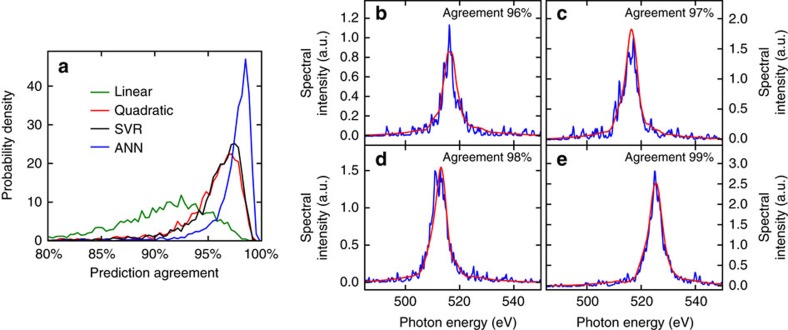
Figure 3. Spectral shape prediction for a single pulse.
(a) Distribution of agreements between the predicted and the measured spectra for the test set using the four different models. SVR: Support vector regressor. ANN: Artificial neural network. (b–e) Examples of the measured (blue) and the predicted (red) spectra using an ANN to illustrate the accuracy for different agreement values. The four examples have been chosen by picking from the entire test set the events with agreement values closest to 96%, 97%, 98% and 99%, respectively.

