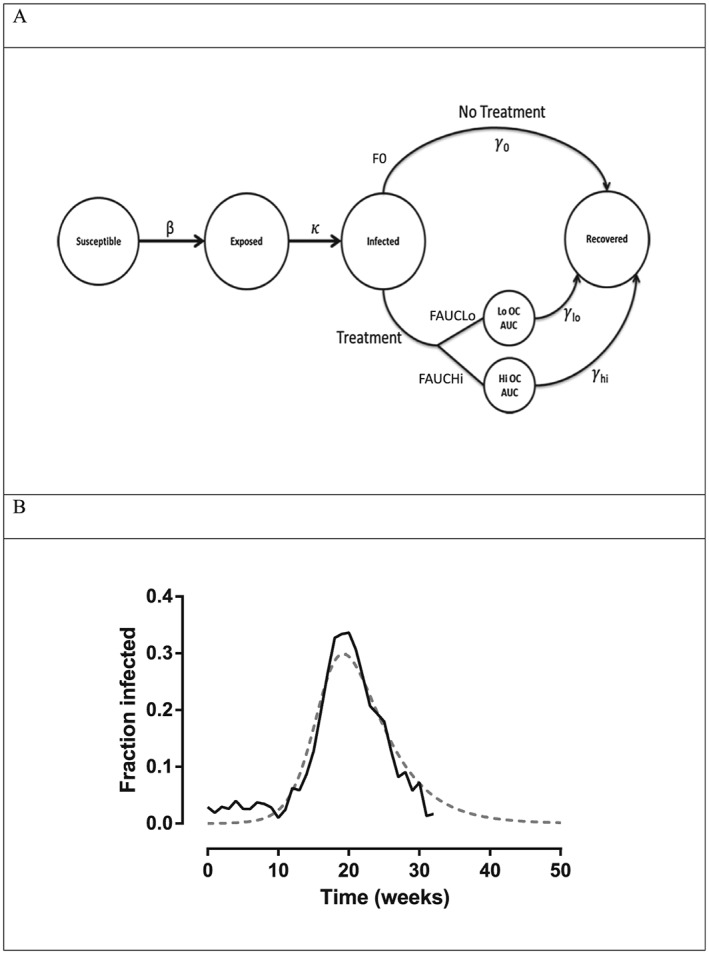
Figure 2.

Epidemiology module. Figure 2A shows the SEIR (susceptible, exposed, infected, recovered) influenza epidemiology model adapted to account for oseltamivir treatment effect. Figure 2B shows fit of the SEIR model to 2007–2008 Influenza Epidemic Data from the Midwestern USA (http://www.cdc.gov/flu/weekly/pastreports.htm). The fitting produced parameter values of β = 0.73, γ = 4.1 day, and 1/κ = 1 day. The grey dotted line represents model fitted function; the solid black line represents actual data. AUC, area under the concentration‐time curve; OC, oseltamivir carboxylate
