
Figure 7.
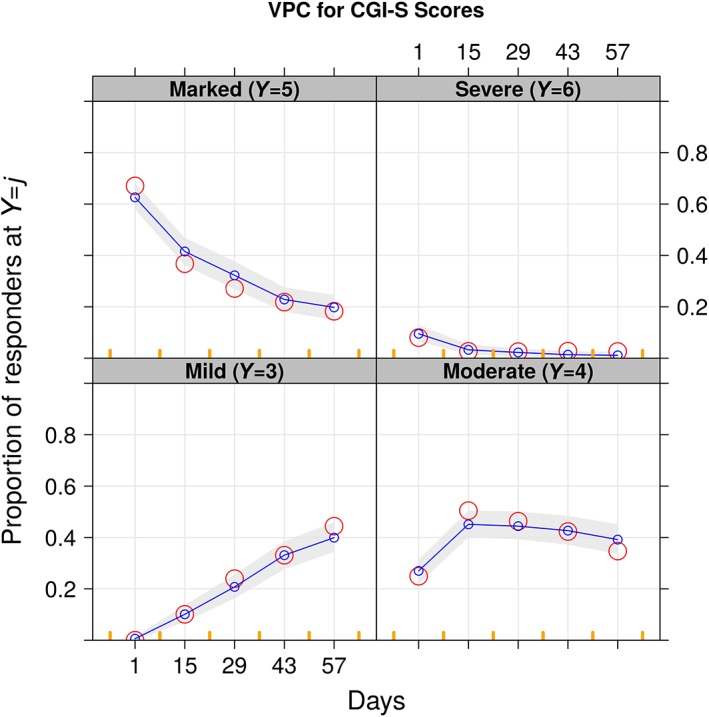
Visual predictive checks for CGI‐S vs. time. The red circles are the observed proportions, whereas the blue lines are the medians and the 5th and 95th percentiles of the simulation that is also shown by the shaded area
Official websites use .gov
A
.gov website belongs to an official
government organization in the United States.
Secure .gov websites use HTTPS
A lock (
) or https:// means you've safely
connected to the .gov website. Share sensitive
information only on official, secure websites.
Visual predictive checks for CGI‐S vs. time. The red circles are the observed proportions, whereas the blue lines are the medians and the 5th and 95th percentiles of the simulation that is also shown by the shaded area