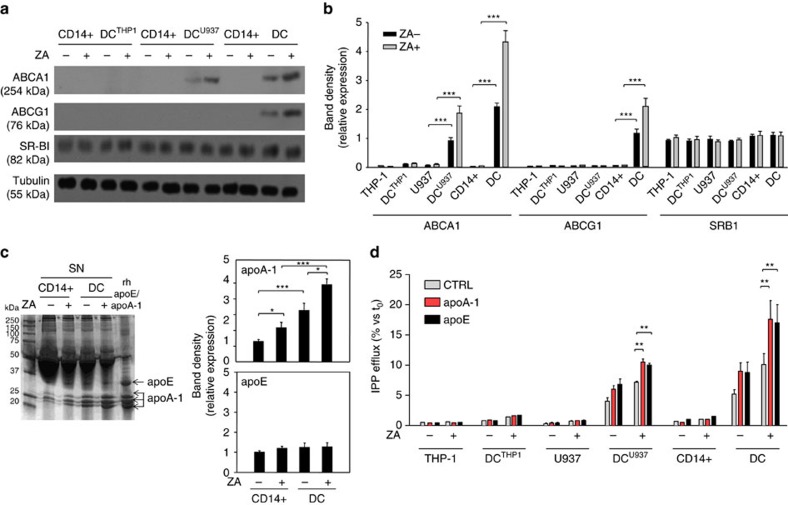
Figure 2. ZA treatment increases ABCA1 and apoA-1 expression.
(a) Western blot analysis of ABCA1, ABCG1 and SR-BI expression in untreated (ZA-) and ZA-treated (ZA+) THP-1 cells, U937 cells, CD14+ cells and corresponding DC subsets (DCTHP1, DCU937, DC). ABCA1 was already detectable in DCU937 and DC and its expression was upregulated by ZA. β-tubulin was employed to check the equal protein loading per lane. The results are obtained from one representative experiment of three experiments. (b) Pooled data obtained by densitometric analysis with ImageJ software (http://imagej.nih.gov/ij/). The results are expressed as arbitrary units (THP-1 cells and DCTHP1, n=3; U937 cells and DCU937, n=3; CD14+ cells and DC, n=14) (***P<0.001; ANOVA). (c) Supernatants from untreated (ZA-) or ZA-treated (ZA+) CD14+ cells and DC were resolved by SDS–PAGE and stained with Coomassie brilliant blue. A concentration of 1 μg ml−1 recombinant human apoE or apoA-I were employed as standards. Densitometric analyses of bands identified as apoE or apoA-I by MALDI-TOF/MS were performed with ImageJ software. The results are expressed as arbitrary units. The gel is representative of one out of the three experiments (*P<0.05, ***P<0.001; ANOVA). (d) Extracellular IPP released in the supernatants retrieved from untreated (ZA-) or ZA-treated (ZA+) CD14+ cells, U937 cells, THP-1 cells and corresponding DC subsets (DC, DCU937, DCTHP1) in the absence (CTRL) or presence of human recombinant 1 μg ml−1 apoA-I or apoE added during the last 24 h of incubation. apoA-I and apoE increased the IPP release in DC and DCU937 but did not increase the IPP release in DCTHP1. The bars represent the mean value±s.e.m. of three experiments (**P<0.01; ANOVA). ANOVA, analysis of variance. MALDI-TOF/MS, matrix-assisted laser desorption ionization-time-of-flight/mass spectrometry. SDS-PAGE: sodium dodecyl sulfate-polyacrilammide gel electophoresis.

