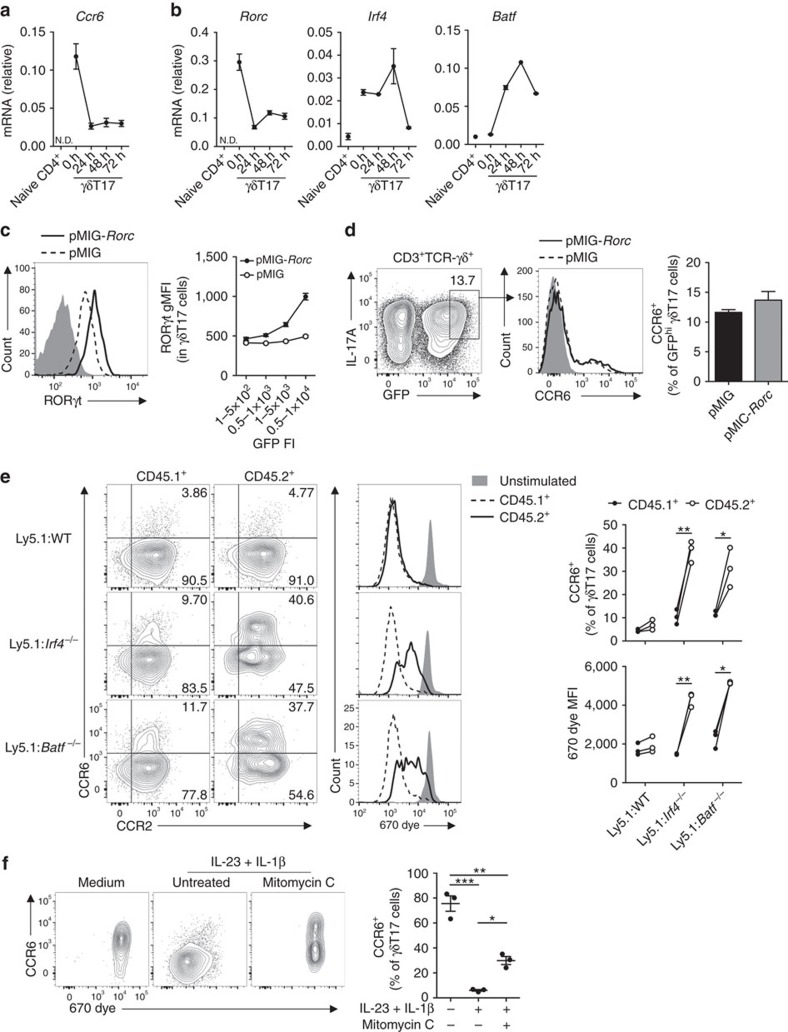
Figure 5. IRF4 and BATF promote CCR6 downregulation in γδT17 cells.
(a) Ccr6 and (b) transcription factor mRNA in sorted γδT17 cells from Il17aCre × Rosa26eYFP lymphocytes ex vivo or cultured with IL-23/IL-1β for indicated times (pooled from 5 to 7 mice). ND, not detected. (c,d) Expanded γδT17 cells (n=3) were transduced with empty pMIG or pMIG-Rorc retrovirus. (c) Representative flow cytometry of RORγt expression in GFPhi γδT17 cells (gated as in d), relative to isotype (grey) and geometric mean fluorescence intensity (gMFI) relative to GFP fluorescence intensity (FI). (d) Representative flow cytometry of CCR6 expression and quantitation in GFPhi γδT17 cells. (e) Splenocytes from Ly5.1 and either wild type (WT), Irf4−/− or Batf−/− mice were 670 dye-labelled, mixed 50:50 and stimulated with IL-23/IL-1β for 72 h. Representative flow cytometry and quantitation of CCR6 expression and proliferation in CD45.1+ or CD45.2+ γδT17 cells (n=3/group). (f) Representative flow cytometry and quantitation of CCR6 expression by 670 dye-labelled γδT17 cells from WT splenocytes cultured with IL-23/IL-1β for 72 h with/without mitomycin C pre-treatment (n=3). See also Supplementary Figs 6 and 7. (a,b) Mean±s.d., (c–f) Mean±s.e.m. (a–f) Representative of two similar experiments. (d,e) Paired two-tailed Student's t-test, (f) one-way paired ANOVA with Bonferroni's multiple comparisons test. *P<0.05, **P<0.01, ***P<0.001.

