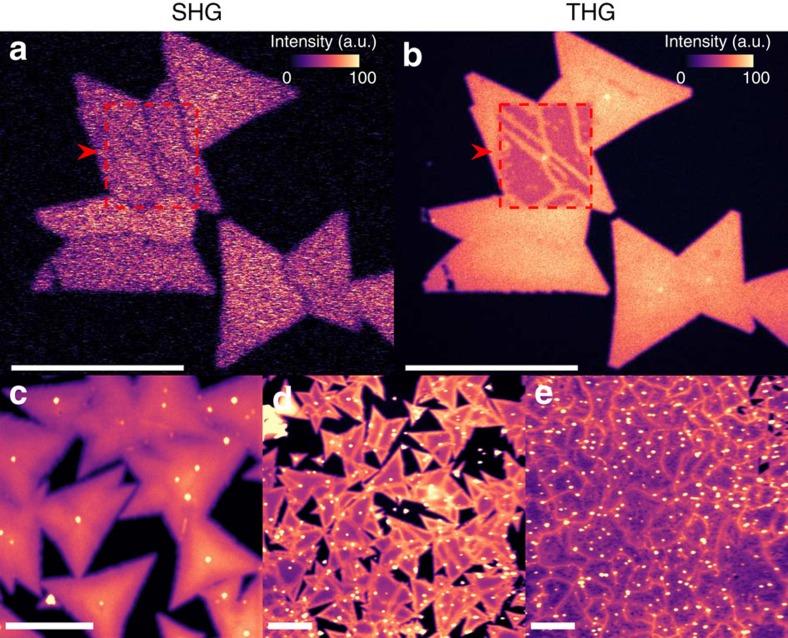
Figure 1. Multiphoton imaging of CVD-grown large-area MoS2 flakes.
(a) SHG and (b) THG images of Sample 1. An area of ∼25 × 30 μm2 is first exposed (marked by a red dashed border) by scanning over it with the same laser used for the multiphoton laser-scanning microscopy. The laser beam had a fluence of 21 mJ cm−2 and scanning speed was 20 μs per pixel. After exposure, the SHG and THG images have been captured using a laser fluence of 11 mJ cm−2. In a, the GBs with larger crystal orientation mismatch are visible in SHG images, which show no visible difference between the exposed and unexposed areas. In b, all the GBs are clearly visible in THG images on the exposed area. Similar THG images of (c) as-grown MoS2 sample without any post treatments and (d,e) as-grown MoS2 samples after ACE+IPA treatment. The GBs appear bright after ACE+IPA treatment. The laser fluence in c–e was ∼177 mJ cm−2. Scale bars, 25 μm (a,b) and 50 μm (c–e).

