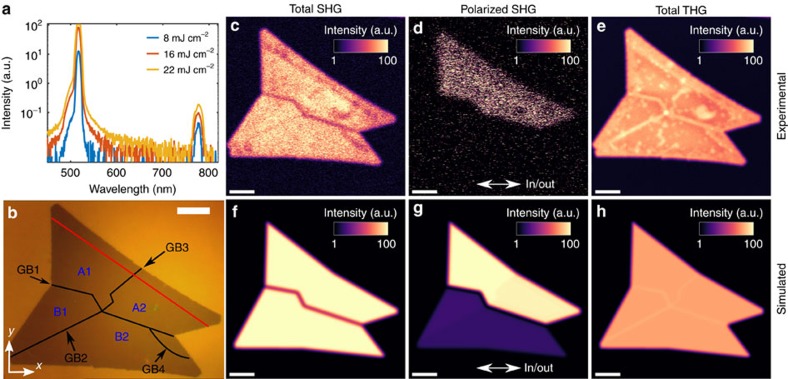
Figure 2. Multiphoton characterization results.
(a) Generated multiphoton spectra with different input fluences, (b) optical image with marked grains (A1, A2, B1 and B2) and grain boundaries (GB1, GB2, GB3 and GB4), (c) experimental SHG image without analyser, (d) experimental SHG image with parallel polarized excitation and detection (as indicated by a double-headed arrow), (e) experimental THG image without analyser, (f) simulated SHG image without analyser, (g) simulated SHG image with parallel polarized excitation and detection (as indicated by a double-headed arrow) and (h) simulated THG image without analyser. Scale bars, 10 μm. Colour scale bars are the counts from photomultiplier tubes.

