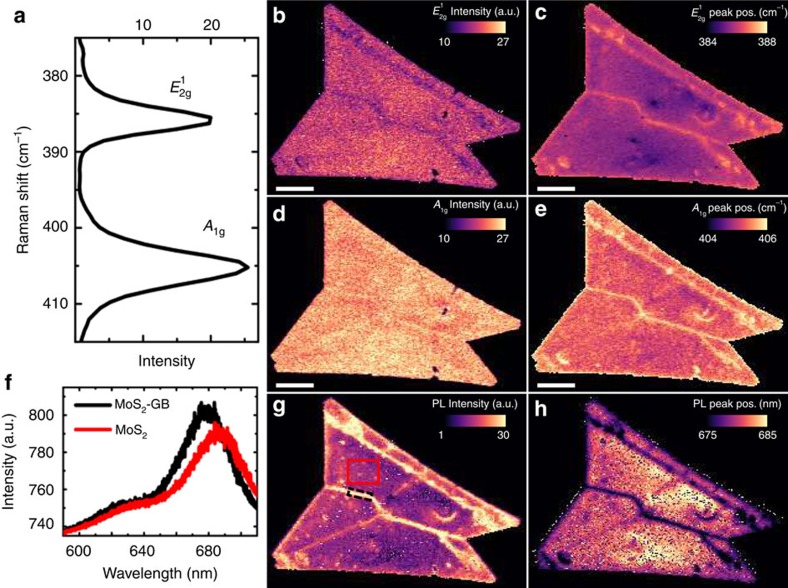
Figure 3. Raman and photoluminescence characterization.
(a) Raman spectrum, (b) intensity of  peak, (c) centre position of
  peak, (d) intensity of A1g peak and (e) centre position of A1g peak, (f) PL spectra from the middle of the grain A1 (red curve, taken from the area marked with white line in g and from GB1 in the middle of the flake (black curve, taken from the area marked with a black dashed line in g. (g) PL intensity image of the 680 nm peak and (h) centre position of the 680 nm peak. Intensities and peak positions are acquired by Gaussian fitting. Scale bars, 10 μm. Colour scale bars are in CCD counts (Raman and PL intensities), in cm−1 (Raman peak positions) and in nm (PL peak position).

