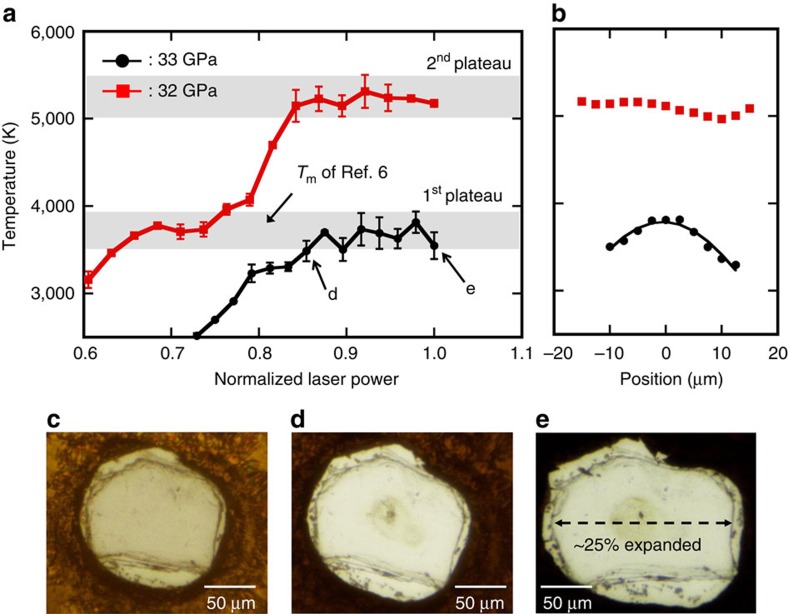
Figure 2. Temperature versus normalized laser power profiles together with radial temperature distributions and microscopic images.
(a) Circles and squares represent the profiles in laser heating at 33 and 32 GPa, respectively. The temperature errors were estimated by considering the difference between the temperatures obtained from the both sides of the cell. The grey shaded areas show the temperature ranges where plateaus were observed. (b) Circles and squares represent the temperature distributions in the MgO sample under heating at the first and second plateaus, respectively. The curve represents the fitting by the Gaussian function. (c–e) Microscopic images of the sample before (c) and after heating (d,e). The sample was found to have expanded by ∼25 % in the lateral direction after quenching from 3,700 K.

