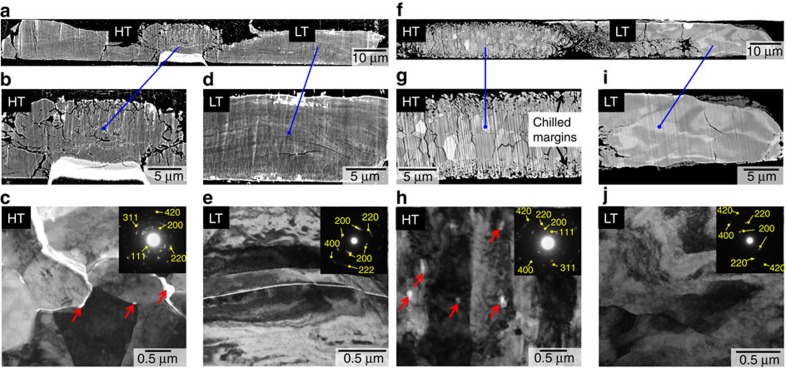
Figure 3. Cross-section images of the recovered samples.
(a–e) The sample recovered from 28 GPa and 3,800 K. (f–j) The sample recovered from 32 GPa and 5,200 K. (a,b,d,f,g,i) Orientation contrast images. (c,e,h,j) TEM bright field images. The region labelled ‘HT' in each low-magnification image (a,f) is the laser-heated hot spot, while LT indicates the surrounding low-temperature region. The red arrows in c,h indicate small voids that are interpreted as remnants of liquid Ar (pressure medium) formed and trapped during grain growth of MgO at high temperature. Insets in c,e,h,j show electron diffraction patterns collected from each corresponding image, which are assigned to MgO (Supplementary Fig. 5, Supplementary Table 2 and Supplementary Note 1).

