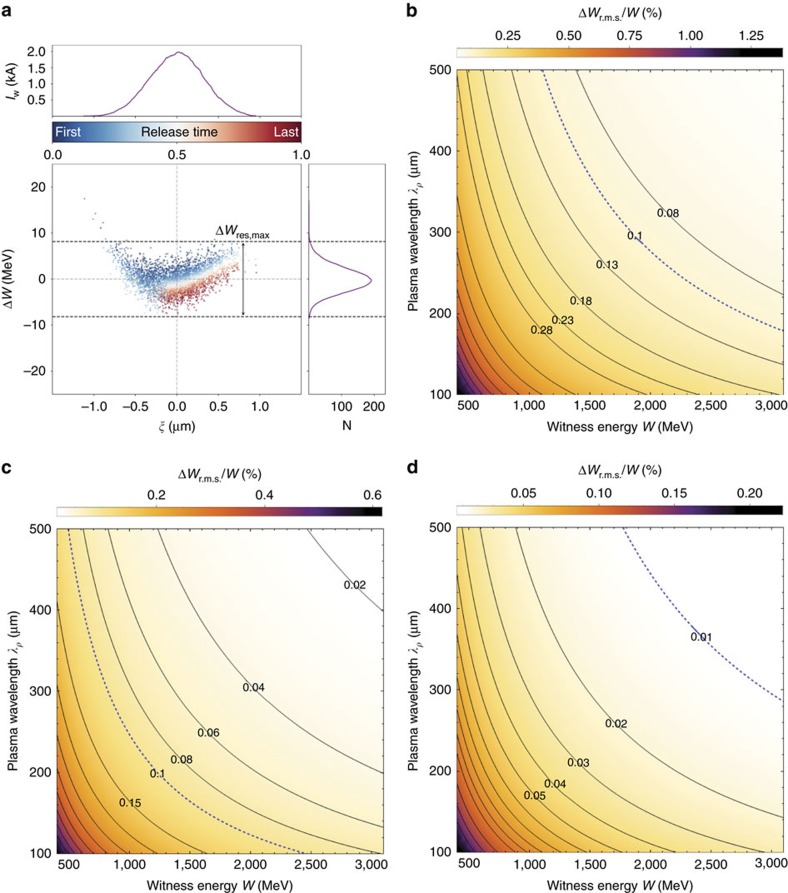
Figure 5. Residual energy spread from simulation and scaling prediction.
Absolute residual witness energy spread from simulation (a) and relative energy spread from scaling predictions (b–d). In (a), the residual energy spread as observed in the PIC-simulation at minimum energy spread position (corresponding to the case depicted in Fig. 3c) is shown with color-coding of laser-released witness electrons, where position 0 indicates the first electron released and position 1 indicates the last electron released. Electrons which are released earlier (blue) are gaining more energy than those released later (red), in accordance with the numerical scaling estimation. b–d show relative energy spread predictions based on the residual energy spread scaling for a witness release laser spot size of w0,w=10 μm (b), w0,w=7 μm (c) and w0,w=4 μm (d) in dependence of witness bunch energy and wavelength of the accelerating plasma wave. Isolines depict the combinations of constant relative energy spread for selected values.

