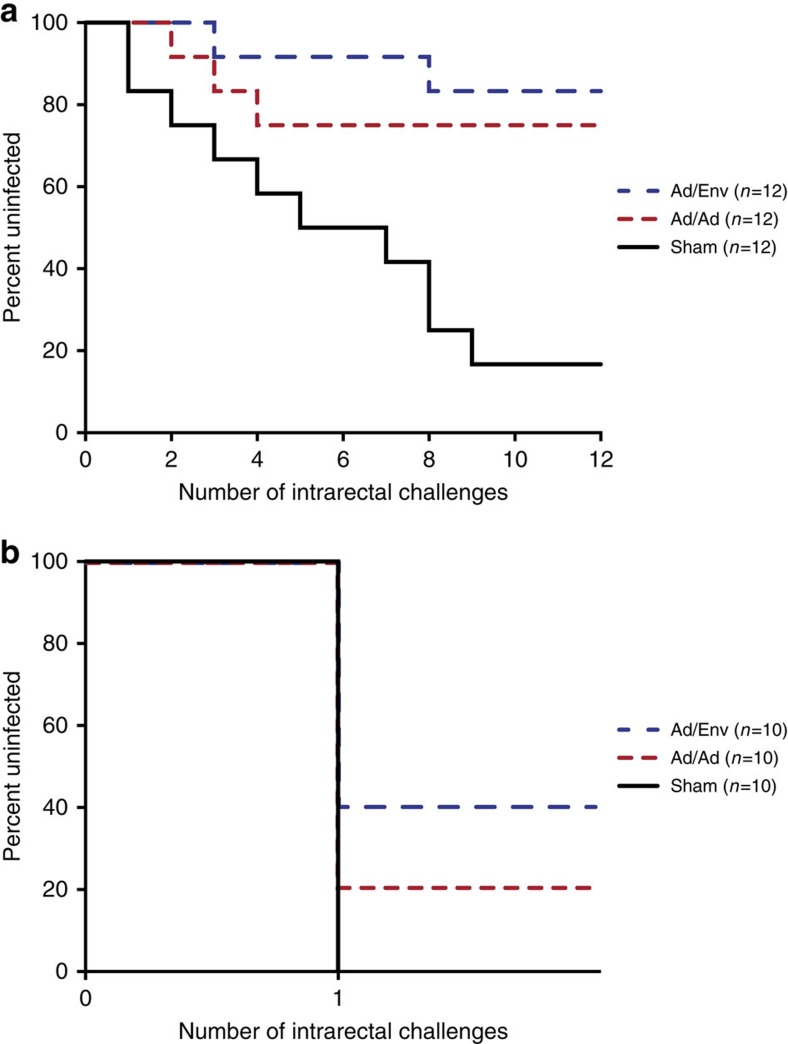
Figure 2. Protective efficacy.
The number of challenges required for detection of productive infection for each vaccine group. Kaplan–Meier plot indicates the percent of uninfected animals after each challenge. Ad/Env (blue) indicates animals primed with Ad35/Ad26 and boosted with adjuvanted Env gp140 (Ad35/Ad26/Env). Ad/Ad (red) indicates animals vaccinated with Ad35/Ad26 only. The RLD challenge study (a) shows infections over time with protection in 75% of Ad/Ad vaccinated animals and 85% of Ad/Env vaccinated animals. The SHD challenge study (b) shows infections in all control animals and protection in 20% of Ad/Ad vaccinated animals and in 40% protection in Ad/Env vaccinated animals.

