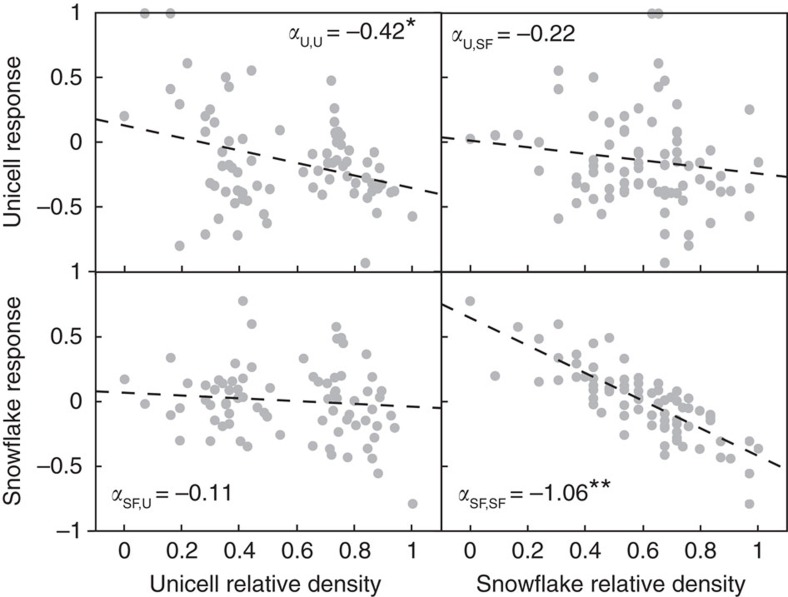
Figure 3. Competition during settling is strongest within phenotypes.
Snowflake (SF) and unicell (U) numerical responses to settling (that is, the log ratio of density after and before settling, m) have been standardized and centered around zero (y axis) and relative density represents the log density (CFU ml−1), scaled from 0 to 1 (x axis). Dashed lines show the prediction from the model response mi=ci+αii Ni+αij Nj, (fit by ordinary least squares) where c is the intercept, α are competition coefficients, i is the focal phenotype, j the opposite phenotype and N is log density of each phenotype before selection. Settling performance declined significantly with increasing abundance of like phenotypes for both unicells (P=0.0038) and snowflakes (P<0.0001), whereas neither cross-phenotype competitive effect was significant (SF effect on unicells: P=0.2, unicell effect on SF: P=0.12; see Supplementary Data 3 for all parameter estimates).

