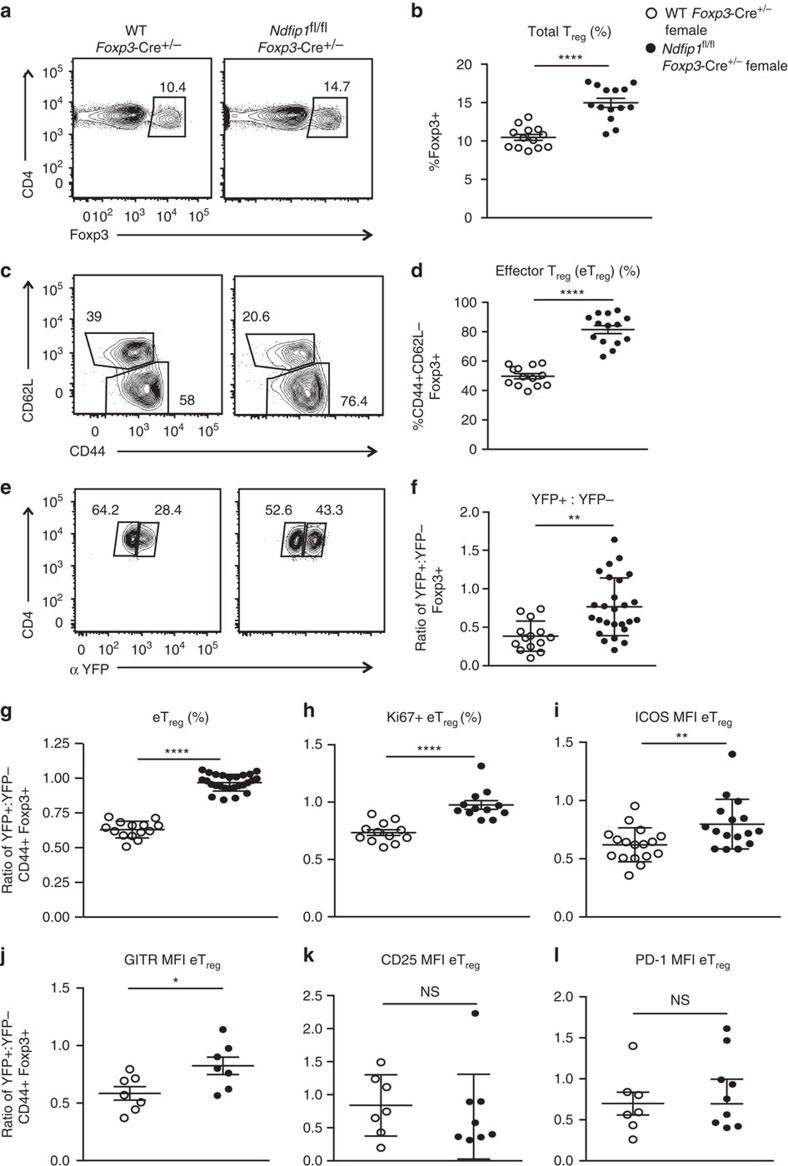
Figure 3. Female Ndfip1fl/flFoxp3-Cre+/− mice show similar Treg cell changes as males.
(a–l) Lung homogenates, from 8- to 16-week-old hemizygous female Ndfip1fl/fl Foxp3-Cre+/− mice and Ndfip1+/+ Foxp3-Cre+/− controls, were analysed ex vivo by flow cytometry. (a) Representative flow plots showing the gating of Treg cells (previously gated as live CD3+CD4+ cells). This gating was used to determine the overall frequencies of Treg cells (b) in mice from the indicated genotypes. (c) Representative flow plots showing the gating of Treg cells from a that are eTreg or cTreg cells. This gating was used to determine the (d) frequencies of eTreg cells. (e) Representative flow plot of Treg cells as gated in a and analysed for frequencies of YFP+ and YFP− cells. (f) Ratio of YFP+ to YFP− Treg cells. (g,h) Percentages of (g) eTreg cells or (h) Ki-67+ eTreg cells, shown as a ratio of YFP+:YFP− cells within each mouse to normalize for a Cre effect. (i–l) mean fluorescence intensity (MFI) of (i) ICOS, (j) GITR, (k) CD25 and (l) PD-1 expression on eTreg cells, again shown as a ratio of YFP+:YFP−. P values determined by Student's t-test, with correction for unequal variances as appropriate. *P<0.05, **P<0.01, ***P<0.001, ****P<0.0001. Each dot shows data acquired from a single female mouse. Graphs show mean±s.e.m. All experiments were performed on at least two independent occasions.

