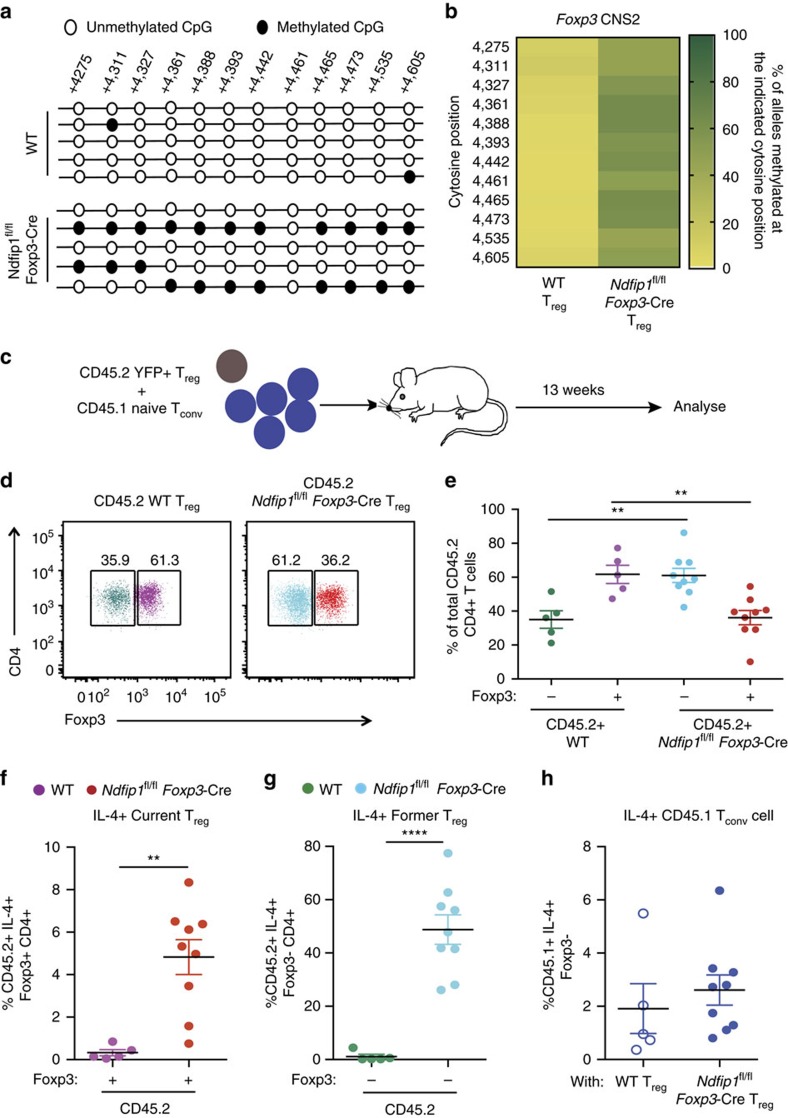
Figure 5. Ndfip1-deficient Treg cells have Foxp3 locus instability and lose Foxp3 in vivo.
(a,b) YFP+ eTreg cells were sorted from 9- to 12-week-old WT or Ndfip1fl/fl Foxp3-Cre male mice and assessed for CNS2 methylation using bisulfite sequencing. (a) Representative data of methylation at the Foxp3 CNS2 locus in Treg cells from the two genotypes. (b) Quantification of methylation at 12 CpG islands in the Foxp3 CNS2 locus. Data shown are compiled from three mice of each genotype. Data are the percentage of alleles methylated at each position. (c–h) YFP+ Treg cells from CD45.2+ WT or Ndfip1fl/fl Foxp3-Cre mice were mixed 1:5 with CD45.1+ WT naive Tconv cells and transferred to Rag1−/− recipients. Cells from lung homogenates were analysed for Foxp3 and IL-4 expression using flow cytometry 13 weeks after transfer. (d) A representative flow plot showing CD45.2+ WT and Ndfip1fl/fl Foxp3-Cre cells that were analysed for the expression of Foxp3. (e) Compiled data from multiple mice analysed as in d. (f) Percentages of IL-4-producing cells that remained Foxp3+ (current Treg cells ) and (g) that had become Foxp3− following transfer (former Treg cells ). (h) Percentages of IL-4-producing CD45.1 Tconv cells. All experiments were performed on at least two separate occasions. Each dot represents cells from an individual mouse. P values were calculated by one-way ANOVA. *P<0.05, **P<0.01, ***P<0.001, ****P<0.0001. Graphs show mean±s.e.m.

