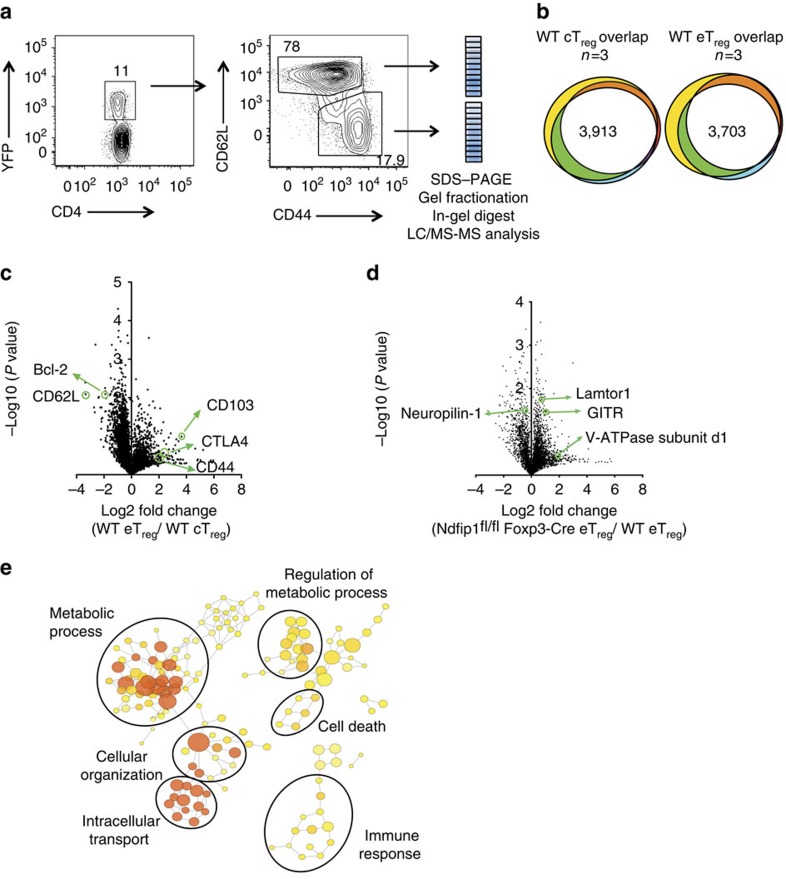
Figure 6. Ndfip1fl/flFoxp3-Cre eTreg cells have altered metabolic whole-cell proteome.
(a) Representative flow cytometry dot plots and gel pixelation to illustrate procedure used to analyse cTreg and eTreg cell proteomes using mass spectrometry. (b) Area-proportional Venn diagrams illustrating the reproducibility of proteins identified in cTreg (left) or eTreg (right) cells from three independent experiments. WT cells were compared for this analysis and data were compiled using the intensity-based absolute quantification method. (c) A volcano plot illustrating differentially expressed proteins between eTreg versus cTreg cells in WT mice. (d) A volcano plot representing differentially expressed proteins between eTreg cells from Ndfip1fl/fl Foxp3-Cre or WT animals. (e) Network diagram of enriched GO terms with nodes representing GO annotations and edges connecting similar terms based on the GO hierarchy. The size of the nodes corresponds to the number of genes associated with the respective GO term and the colour of the nodes corresponds to the level of significance of the enrichment of the respective term in the data set (darker colour corresponds to a higher level of significance). Clusters of GO terms were manually analysed and annotated to identify broad functional similarity. Data are shown for YFP+ eTreg cells that were sorted from 9- to 12-week-old WT or Ndfip1fl/fl Foxp3-Cre male mice.

