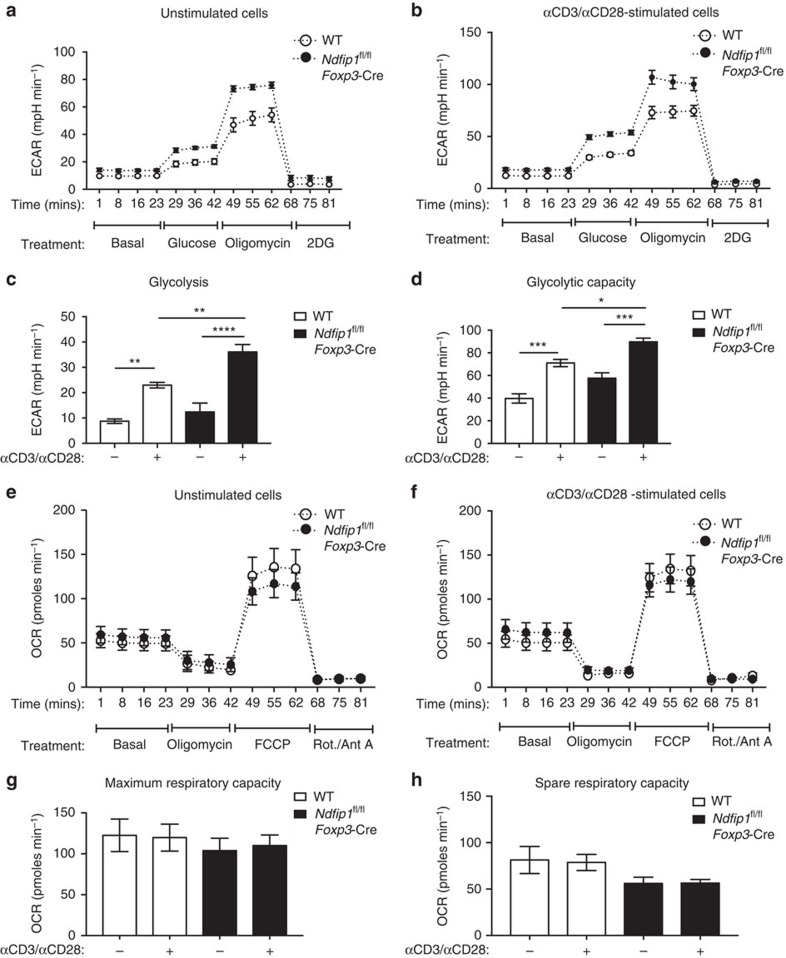
Figure 7. Ndfip1-deficient Treg cells have a significantly increased rate of glycolysis.
(a–h) YFP+ Treg cells were sorted from Ndfip1+/+ Foxp3-Cre WT or Ndfip1fl/fl Foxp3-Cre mice, expanded in culture and then were left unstimulated or were restimulated before metabolic function was assessed. (a,b) Extracellular acidification rate (ECAR) was measured during a glycolysis stress test in a unstimulated or (b) stimulated Treg cells treated with drugs as indicated. (c) Rate of glycolysis is the difference in ECAR between post-glucose addition and baseline. (d) Glycolytic capacity is the difference between post-Oligomycin ECAR and baseline ECAR. (e,f) Oxygen consumption rate (OCR) changes during a mitochondrial function assessment test in e unstimulated or (f) stimulated WT or Ndfip1fl/fl Foxp3-Cre Treg cells treated with drugs as indicated. (g) Maximum respiratory capacity is the difference in OCR after addition of rotenone/Antimycin A versus after addition of fluoro-carbonyl cyanide phenylhydrazone (FCCP). (h) Spare respiratory capacity is the difference in increased OCR following addition of FCCP compared to baseline. Graphs show mean±s.e.m. (a–d) Represents n=4 mice (male or female, 7–12 weeks) per genotype in two independent experiments. Final Foxp3% after in vitro expansion was 74.45%±8.03 for Ndfip1fl/fl Foxp3-Cre versus 74.8±9.80 for Ndfip1+/+ Foxp3-Cre. (e–h) Represents n=6–8 mice (male and female, 7–12 weeks) in three experiments. Final Foxp3% was 88.1±2.08 for Ndfip1fl/fl Foxp3-Cre versus 86.43±1.94 for Ndfip1+/+ Foxp3-Cre. P values were calculated by one-way ANOVA. *P<0.05, **P<0.01, ***P<0.001, ****P<0.0001.

