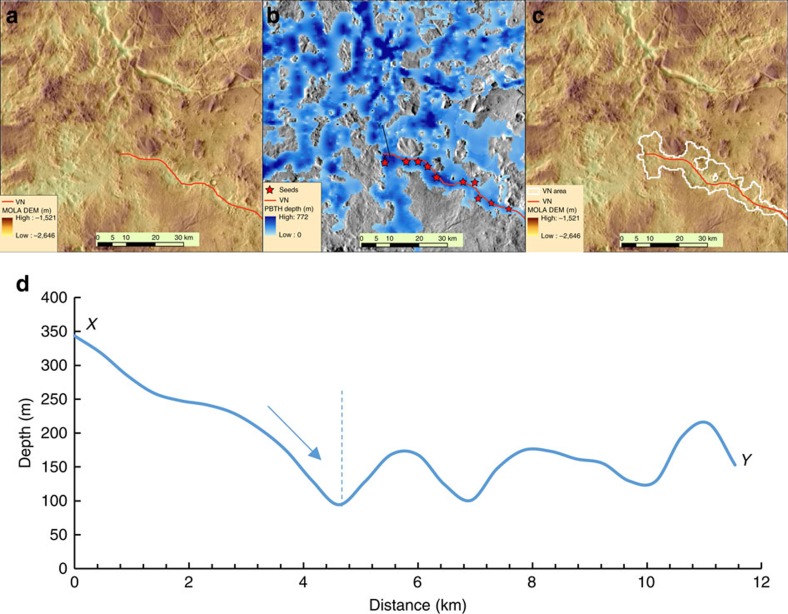
Figure 2. Valley area growth from seeds by multi-flow direction.
(a) VN and shaded MOLA DEM (for location, see Fig. 3b). (b) VN, thresholded PBTH depth and local maxima ‘seeds' for generating VN area following multi-flow direction on depth grid. (c) VN, VN area polygon and shaded MOLA DEM. (d) Depth profile along XY in b. Dashed vertical line indicates where the flow would stop, which defines the boundary of VN area polygon as shown in c.

