
Figure 1.
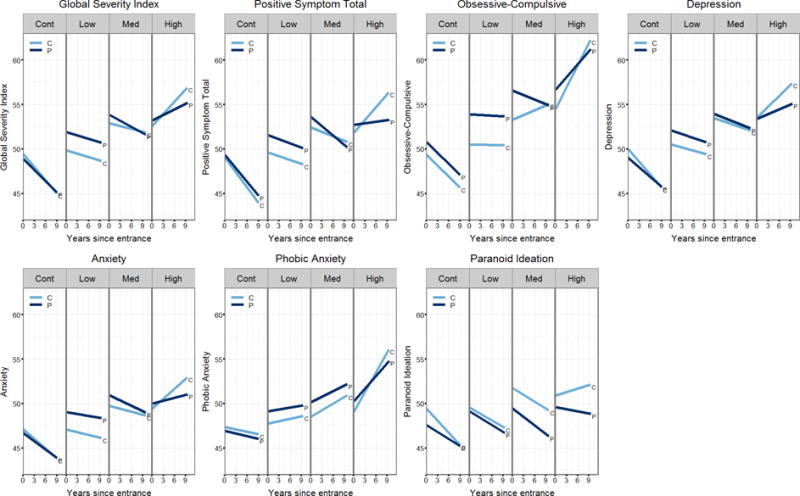
Fitted Linear Mixed-Effects Regression (LMER) curves by group for participant and companion Symptom Checklist-90-Revised (SCL-90-R) ratings. All model coefficients were estimated adjusting for gender, years of education, and age at entry. The plots show the SCL-90-R score as a function of duration, person (participant or companion) and group. Low, Med, High indicate low, medium, or high probability of diagnosis within five years as estimated by CAG-Age Product (CAP) score.