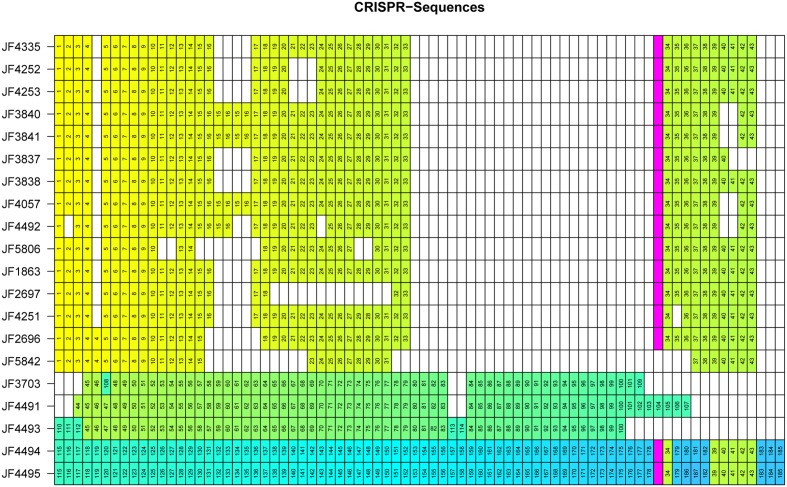
FIGURE 5.
Matrix representation of CRISPR spacers for each individual C. chauvoei strain. Identical spacers are assigned the same numerical value and color. The IS256 transposase is indicated with in pink and divides the CRISPR sequences into two arrays. White spaces are artificial due to the visual representation lining up identical CRISPR spacer sequences and do not represent DNA sequences of the individual genomes. The order of the strains, from top to bottom was arranged to follow clusters and subgroups of the phylogenetic tree of the SNV analysis (Figure 3).

