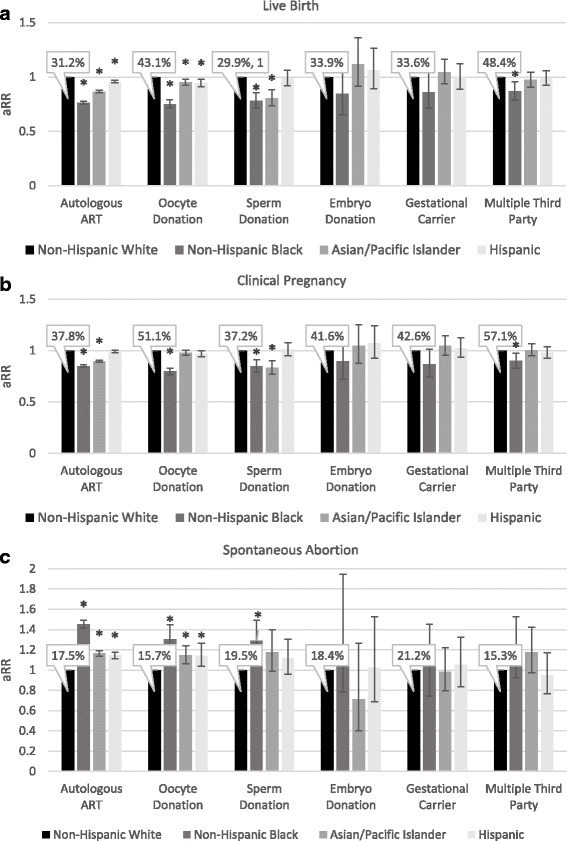
Fig. 4.

Adjusted relative risk for live birth rates (a), pregnancy rates (b), and spontaneous abortion rates (c) for each ART modality, stratified by race and ethnicity of the intended mother. Non-Hispanic White women were the reference group for all comparisons, data is adjusted for age of the intended mother and oocyte donor. A generalized estimating equation (GEE) model was used to controlled for patients with multiple cycles. Bars represent 95% confidence intervals. Percentages indicate live birth rates for each treatment modality among Non-Hispanic White women. * indicates P-value <0.05
