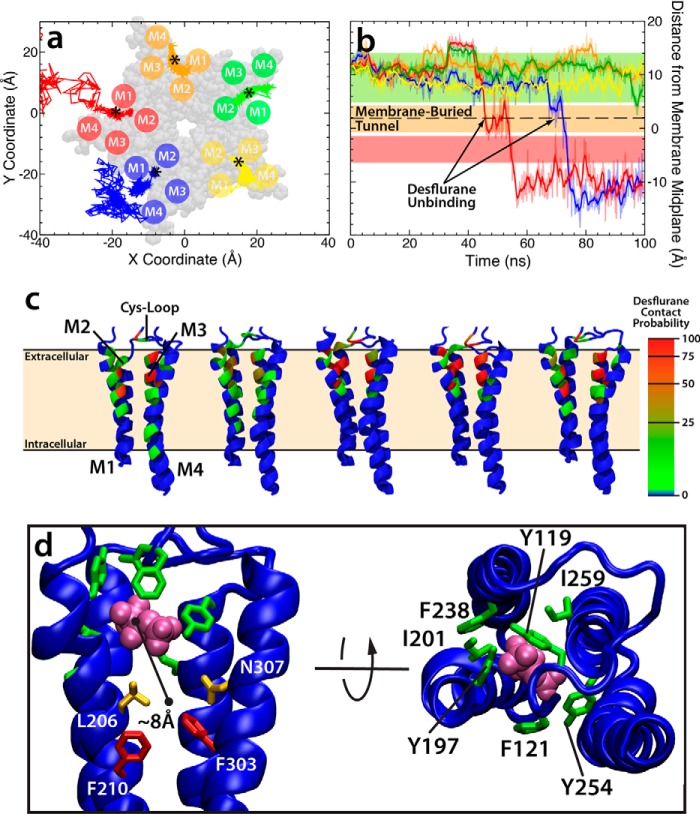
Figure 2.
Desflurane is loosely bound to the intrasubunit site identified in crystal structure. The data in this figure comes from the 100-ns simulation starting from the fully bound state in which desflurane is initially bound as observed from the crystal structure. a, plot of the position of each anesthetic projected onto the xy plane as a function of time. In the case of the blue and red subunits, desflurane spontaneously and completely exits the protein. The asterisk denotes the initial center of mass of each anesthetic at t = 0 ns. The structure of the TMD is shown in transparent gray van der Waals representation. The approximate location of the M1-M4 helices in each subunit is shown as a circle. b, plot of the height of the center of mass of each anesthetic as a function of time. The colored lines here represent the subunit the anesthetic was initially bound to in a. The colored bars correspond to the position of the amino acids pictured in d. Desflurane contact probabilities (c) are mapped onto the backbone of each residue for individual subunits as discussed under “Experimental Procedures.” The color on the protein corresponds to how often the desflurane in that subunit contacts the protein (defined as within 3.5 Å of any atom in the residue) and is adjusted so that a contact probability >50% is red. The first two subunits from the left are those in which the desflurane unbinds and exits. d, molecular images showing side and top views of the position of bulky residues that block the exit (green and red) and residues with comparatively smaller side chains that allow desflurane to exit into the lipid bilayer (orange). The color of the residues in this image corresponds to the same colored horizontal bars in b.

