
Figure 9.
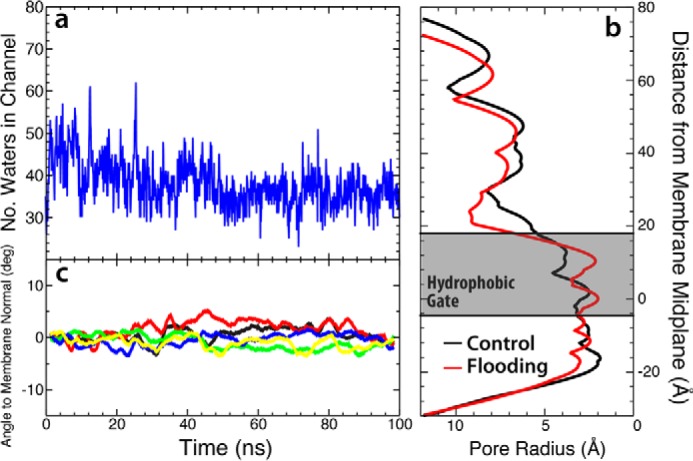
Structure of GLIC channel in control simulation. a, plot of the water number in the hydrophobic gate as a function of simulation time. The number of waters in the hydrophobic gate remains constant throughout the simulation. b, plot of pore radius for both the control/anesthetic-free simulation (black) and the flooding simulation (red) found using the HOLE program (46). Presented here is the final frame of each simulation. c, plot of the angle between the M2 helix and the membrane normal as a function of time for each subunit, similar to Fig. 3a. The colors in this plot correspond to those of the individual subunits seen in Fig. 2a. Each trace is presented as a running average of the data in windows of 5 ns.